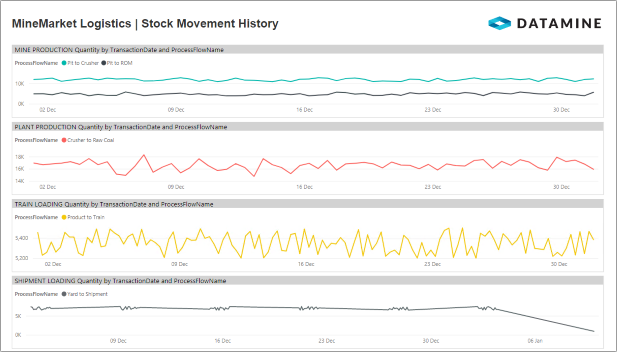
View Stock Movement History
This example uses line chart visuals in Power BI to display information about historical stock movements.
The data comes from the Transaction endpoint in the Inventory Management OData feed.

Quantity by TransactionDate and ProcessFlowName

|
These line chart visuals display transaction data for specific process flows. All of the line charts have the following configuration:
However, each line chart has different basic filtering for the ProcessFlowName in the visual level filters. |

