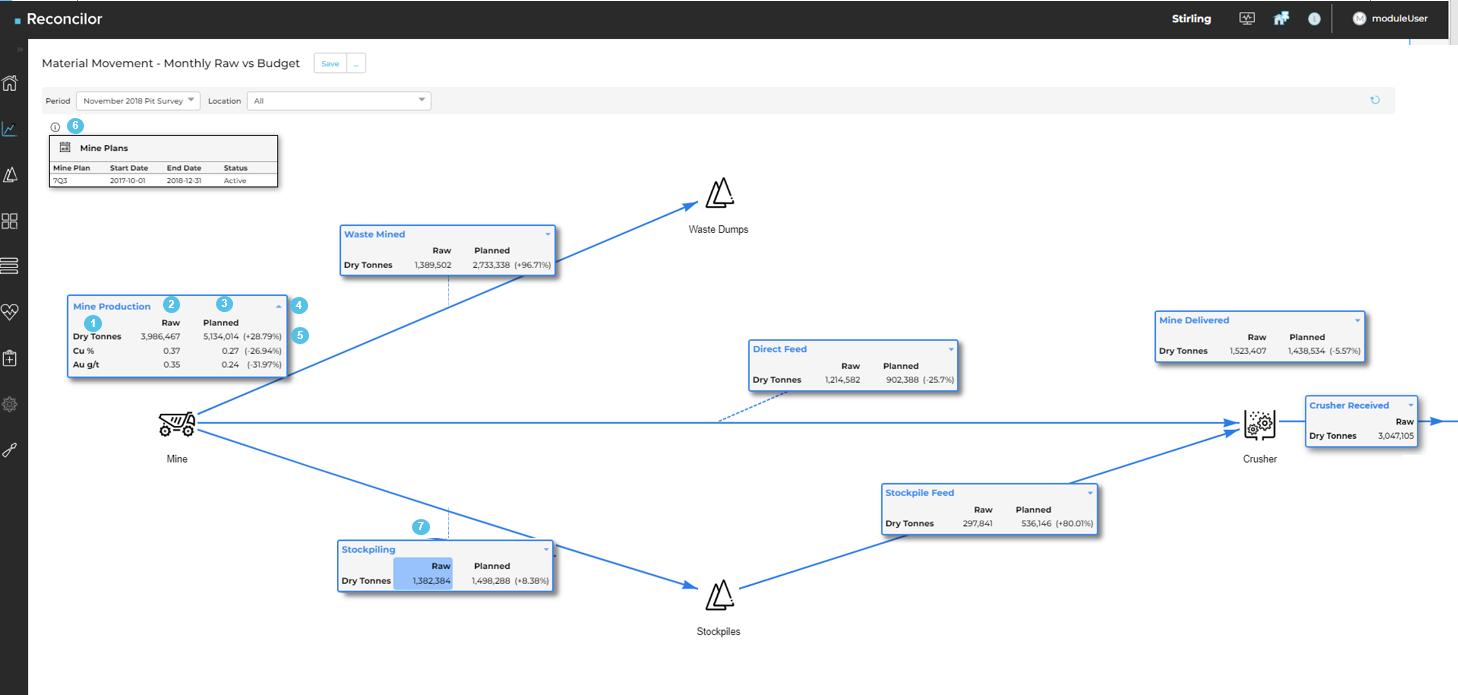
Material Movement Diagram
The example below is for the mine to crusher section of the mine value chain. The other workflows behave in a similar way and all information shown is available across each work flow.

- The measures that were selected in the Configure window will be listed in the first column.
- The display label name and data selected in the first dataset.
- The display label name and data selected in the second (and subsequent datasets).
- The collapse / expand arrow that will show all measures and datasets for a metric, collapsing will only show the first dataset and first measure.
- The % difference between the planned and raw values.
- The information icon will display the mine plans that have been used for the planned data. If multiple plan names are used in a period, each will be list with its active period and status.
- Selecting any dataset on any metric will shrink the material movement flow and table the data for further analysis. See Material Movement Table.

