
QNLM Process
To access this process:
-
Sample Analysis ribbon >> Statistics >> Geochemical Processes >> Q Mode Non Linear Mapping.
- Enter "QNLM" into the Command Line and press ENTER.
-
Display the Find Command screen, locate QNLM and click Run.
See this process in the Command Table.
Process Overview
Q - mode non linear mapping groups together samples using the euclidian distance to calculate a dissimilarity matrix.
As such, it groups samples on the basis of distance (element dissimilarity) between all pairs of samples in multi-dimensional space. These distances are recalculated into two dimensional space for graphical output.
Note the difference with R mode non linear mapping analysis which clusters elements or parameters.
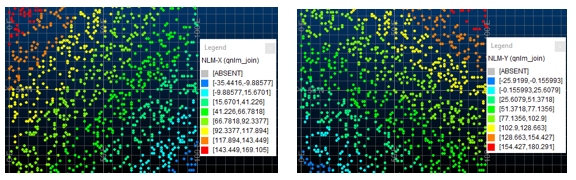
A two dimensional view of the sample clusters, or scores NLM-X versus NLM-Y, is calculated to represent them as they would appear in multi- dimensional space on the basis of their dissimilarity calculated from each other for every pair of samples (see Figure 4). All input data can be standardized (default) prior to calculation of the matrix. Similarly, the output scores can also be normalized prior to plotting (default).
Q - mode non linear mapping, when compared with Q - mode factor analysis, is more sophisticated and tends not to distort or sub-divide the clustering of samples. Experience has shown that non - linear mapping will give more separable clusters than hierarchical techniques such as Q - mode cluster analysis.
File Handling
The input file &(IN) must have a separate identifier field (*SAMPID). The output file &(SCORES) contains three parameters, FIELD the sample identifier, NLM-X and NLM-Y the output scores for plotting the sample distances in multi-dimensional space. Results can be displayed using QUIG, PLOTAN or PLOTDA.
Iteration Procedure
In order to present a two dimensional view of multi-dimensional space with minimum distortion of the sample clusters, the calculated mapping error has to be minimized by an iterative method (steepest descent). This is controlled by the @CONVLIM parameter, that is the minimum difference allowed in the mapping error between iterations, @MAXIT, the maximum number of iterations permitted and the @MAGIC parameter which specifies the stepping function used for each iteration. If the stepping function @MAGIC is decreased, the number of iterations is increased with an obvious time penalty on the length of the calculation. The value used must be taken into account when there are a large number of samples or when using a PC. However the results can be more stable.
Input Files
|
Name |
Description |
I/O Status |
Required |
Type |
|
IN |
Input file. |
Input |
Yes |
Undefined |
Output Files
|
Name |
I/O Status |
Required |
Type |
Description |
|
SCORES |
Output |
No |
Undefined |
Optional output file for non linear mapping scores. |
Fields
|
Name |
Description |
Source |
Required |
Type |
Default |
|
SAMPID |
Sample identifier field in input file. |
IN |
Yes |
Any |
Undefined |
|
F1 |
First field to be used. No fields specified means all. |
IN |
No |
Numeric |
Undefined |
|
F2 |
Second field to be used. |
IN |
No |
Numeric |
Undefined |
|
F3 |
Third field to be used. |
IN |
No |
Numeric |
Undefined |
|
F4 |
Fourth field to be used. |
IN |
No |
Numeric |
Undefined |
|
F5 |
Fifth field to be used. |
IN |
No |
Numeric |
Undefined |
|
F6 |
Sixth field to be used. |
IN |
No |
Numeric |
Undefined |
|
F7 |
Seventh field to be used. |
IN |
No |
Numeric |
Undefined |
|
F8 |
Eighth field to be used. |
IN |
No |
Numeric |
Undefined |
|
F9 |
Ninth field to be used. |
IN |
No |
Numeric |
Undefined |
|
F10 |
Tenth field to be used. |
IN |
No |
Numeric |
Undefined |
Parameters
|
Name |
Description |
Required |
Default |
Range |
Values |
|
CONVLIM |
Convergence limit (0.0001) |
No |
0.0001 |
Undefined |
Undefined |
|
MAGIC |
Convergence [magic] factor (0.35) |
No |
0.35 |
Undefined |
Undefined |
|
MAXIT |
Maximum number of iterations (100) |
No |
100 |
Undefined |
Undefined |
|
STANDARD |
>0 Input data to be standardised (0) |
No |
0 |
0,1 |
0,1 |
|
ZNORM |
>0 NLM scores in output file SCORES to be Z normalised (0). |
No |
0 |
0,1 |
0,1 |
|
|
>0 Display two dimensional x - y coordinates to the screen (0). |
No |
0 |
0,1 |
0,1 |