Create Vein Surfaces - Field Details:
The following options are available for the Create Vein Surfaces dialog. Select
a link for more information:

These functions relate to the input and selection of data for modelling.
Drillholes: select a loaded static drillholes object containing samples to be used for surface construction.
Column: select the attribute containing the values to be modelled. Once a field has been selected, the loaded drillholes will automatically be coloured using the default legend for the selected attribute.
Value: select the key
field value that represents the surface to be modelled. Once a
value has been selected, samples that match the selected value
will be highlighted to show the positive intervals. In addition,
symbols will be added to each interval FROM and TO positions to
highlight the interval that represents the 'positive' samples
to be modelled, e.g.:
You can also process multiple values using the <Batch> option. More about batch processing...
Uncertainty: this check box determines whether you are going to use a Gaussian or Minimum Curvature calculation when generating output data. Some settings on this form are only available for one of these methods; redundant settings will be disabled as appropriate.
-
If the Uncertainty check box is disabled (the default setting) a Minimum Curvature calculation will be performed and the following controls in this group will be enabled:
Best fit plane: choose how surface normals will be calculated; these will either be perpendicular to the mean plane of the data (a plane that lies along the mean average of the positive intervals) or perpendicular to the currently active 3D section. These options are not available when using the Gaussian method. -
Auto: use the mean plane to calculate normals for the output wireframe. This is often a good choice where the expected structure is of a relatively linear nature, without severe directional changes.
For example, the data below shows drillholes in section with the mean plane shown in purple, and the direction of the corresponding normals for the output surface: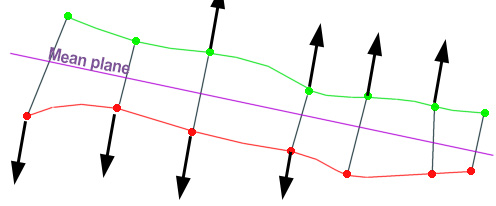
-
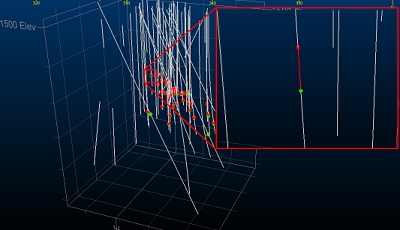
Current section: where more complex data implies a structure of multiple directions, you can orient the currently active 3D section to an orientation that best accommodates the changes in direction (e.g. a 45 degree tilt where surface FW points are in a "L" arrangement in profile). Then, choose the Current section option to model using the current section as the best fit plane.
In the example below, the active section has been oriented so that it creates a surface that represents the inputs. As the initial samples are not aligned in a single directional plane, a custom orientation is a better option than the Auto plane (shown in pink, with pink mean plane normal indicators):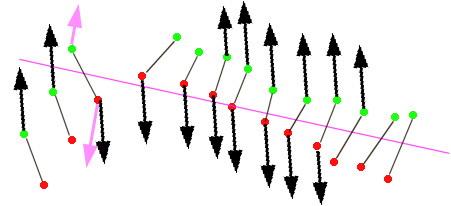
The decision as to how to align a section for a custom mean plane calculation will depend on the overall arrangement of HW and FW points throughout the domain, including how the samples are clustered. Generally, your section bias should represent a reasonable normal assignment for all aspects of your structure. Adjusting the best fit plane is a simple case of modifying the active section and recomputing.
|
|
You can orient your data to a view orthogonal to the mean plane by enabling the Auto Look check box. |
-
If the Uncertainty check box is enabled (the default setting) a Gaussian calculation will be performed and the following controls will be enabled:
Uncertainty slider: this slider is used to determine how closely the generated surface or volume adheres to positive sample intercept positions. with the slider at the far right, no uncertainty will be applied, meaning the generated surface(s) will precisely match the sample intercept positions (both HW and FW surfaces).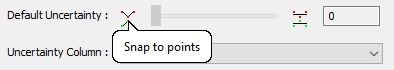
Moving the slider to the left increases the uncertainty value that will be used to determine the position of the HW and FW surface at the sample intercept positions. The slider acts on a logarithmic scale from 0 to 1.
The Default Uncertainty will be applied: -
Where no Uncertainty Column has been selected (i.e. the input Drillholes file contains no uncertainty information, or you choose to ignore it).
-
Where an Uncertainty Column has been selected, but uncertainty values are absent for one ore more sample HW or FW positions.
Uncertainty column: if your sample file contains an uncertainty attribute, select it here, otherwise the Default Uncertainty will be used for all samples. If a value is selected, the Default Uncertainty will still be used for all absent data values. Uncertainty will be applied during the calculation of both mean and HW/FW surfaces. If Uncertainty values is also specified for Additional Points (see below), these will be applied to those points independently.
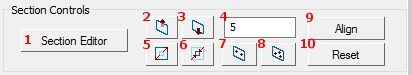
Section Controls: string data is used to define additional points and intervals. Each string vertex becomes a new point to be used during surface or volume construction.
The Auto Look check box is disabled by default. If enabled, the output surface or volume will automatically be zoomed and centred to the default 3D window. The data will also be rotated to view orthogonally from a trend plane calculated throughout all positive data samples.
String
data is digitized onto the current section, which can be modified using
the following tools:
-
Displays the Section Properties dialog, used to define the current section plane for digitizing new points and/or intervals. More...
-
Moves the current section plane forward by the section width. More...
-
Moves the current section plane backward by the section width. More...
-
The current section width. This determines the clipping 'corridor' and the amount of movement applied by the section movement commands.
-
Enlarge the current section dimensions. This can be useful if you wish to apply points outside the current data hull.
-
Shrink the current section dimensions.
-
Define a plane by digitizing two points. It could be useful, say, to snap the points to the FROM and TO positions of a drillhole, then select a vertical or horizontal alignment to align the section with a drillhole direction. More...
-
Define a plane by digitizing three points. This could be useful, for example, to create a plane that aligns with a small group of FROM sample positions, in an area you wish to populate with additional HW points. More...
-
Aligns the current 3D view with the active section. More...
-
Resets the current section definition to the default settings.
Choose how surface normals will be calculated; these will either be perpendicular to the mean plane of the data (a plane that lies along the mean average of the positive intervals) or perpendicular to the currently active 3D section. These options are not available when using the Gaussian method.
-
Auto: use the mean plane to calculate normals for the output wireframe. This is often a good choice where the expected structure is of a relatively linear nature, without severe directional changes.
For example, the data below shows drillholes in section with the mean plane shown in purple, and the direction of the corresponding normals for the output surface:
-
Current section: where more complex data implies a structure of multiple directions, you can orient the currently active 3D section to an orientation that best accommodates the changes in direction (e.g. a 45 degree tilt where surface FW points are in a "L" arrangement in profile). Then, choose the Current section option to model using the current section as the best fit plane.
In the example below, the active section has been oriented so that it creates a surface that represents the inputs. As the initial samples are not aligned in a single directional plane, a custom orientation is a better option than the Auto plane (shown in pink, with pink mean plane normal indicators):
The decision as to how to align a section for a custom mean plane calculation will depend on the overall arrangement of HW and FW points throughout the domain, including how the samples are clustered. Generally, your section bias should represent a reasonable normal assignment for all aspects of your structure. Adjusting the best fit plane is a simple case of modifying the active section and recomputing.
|
|
You can orient your data to a view orthogonal to the mean plane by enabling the Auto Look check box. |
These functions are used to modify existing positive interval definitions, including reversing and toggling sample usage in the construction of 3D output.
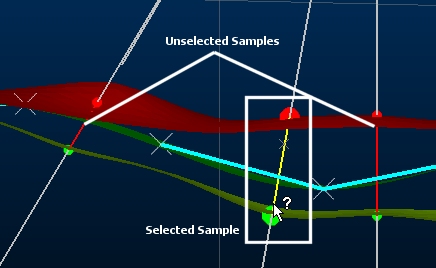
Pick Samples: select to enter sample picking mode. If enabled, any subsequent selection of sample data in the 3D window will highlight the selected sample(s). Selected samples can then be subjected to reversal or toggling. Whilst in picking mode, you can use any selection method to select sample data (single click, CTRL+click, drag a box to select multiple samples).
|
|
You can use <ESC> to quit sample picking mode. |
Auto Reverse All: automatically reverse the hanging wall and foot wall points based on their relative orientation to a mean plane (trend surface) throughout all positive samples. The assignment of points is achieved according to the order in which points occur if moving through the a plane along a normal direction of the mean plane (trend surface) through the data. Double-hanging-wall and double-foot-wall points, if they have been created, will be preserved. The change is instant; it is not necessary to Apply this change.
Use: an independent Use check box is available for both hanging wall (From) and foot wall (To) samples.
You can disable points to determine if selected sample(s) are used in surface generation: if disabled, the green or red indicator disc will disappear from the screen for all selected samples and the point will not be used during surface generation. See Reversing and Ignoring Samples for more information.
Changes to settings must be completed using Apply to update your loaded data.
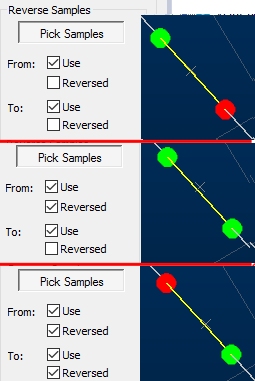
Reversed: choose whether you want the hanging wall or foot wall to be swapped to the opposite intercept position. Selecting either the From OR To data to be reversed will cause a double-hanging-wall or double-foot-wall interval. Choosing both the From AND To positions to be reversed will result in a full inversion of the interval. For example:
Changes to settings must be completed using Apply to update your loaded data.
Apply: apply the current Use and Reversed settings to the currently selected sample(s).
Cancel: click to reinstate default Use and Reversed settings to the currently selected sample(s).
Ignore gaps: this setting is used to manage situations where multiple intervals of the same key field value are present on the same sample. This could be due to multiple intercepts of a structure due to the alignment of the drillhole (e.g. along the strata general trend) or due to gaps in sampling.
|
|
If multiple intersections are detected on any drillhole, the output report will highlight this and report each of the drillhole(s) where this was found to be the case. |
The latter case may be resolved by pre-processing the sample data to remove the unwanted/erroneous/trivial gaps, using commands such as group-lithology and assign-lithology, but you can also choose to either ignore multi-interval samples entirely, or merge samples of each interval into a single continuous unit. Once the Ignore gaps check box to reveal two further options;
-
Merge: use this option to merge all discontinuous intervals into one interval, e.g.:
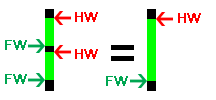
Note that this option will be applied whilst honouring the current Use and Reversed options, where possible. For example, if you elect to ignore and merge gaps on a hole that has one or more HW sample intercepts switched off, each subsequent FW point down hole will be ignored. For example: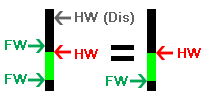
As a rule of thumb, sample gaps will be assumed to exist where more than one HW or FW point exist on the sample. In this situation, a single interval will be assumed between the first HW point and the final FW point in the downhole direction. With the Merge option enabled, then, a single interval will be created for each distinct sample and a surface or volume will be generated correspondingly.
Note that if samples are merged, the trend surface will be calculated according to the merged interval, not the individual unmerged samples. -
Ignore holes with gaps: if this setting is enabled, any sample that contains more than two HW or FW points will not be considered during surface or volume generation.
Use EOH Points: if enabled, end-of-hole positions will be used to construct the foot wall surface if the positive interval is the terminal hole interval. See Using End-of Hole Data for more information.
Update legend: choose how the 3D view will update during vein sample editing, using Update legend.
- If unchecked (default), samples will be displayed using their previously assigned colour formatting options regardless of whether the Vein from Samples command is active.
- If checked, sample colouring is adjusted to highlight particular sample properties during vein modelling, For example, when editing samples.
Insert points and
intervals into your data set to control implicit surface generation
at a granular level. You can find out more about this section
in Adding Samples
and Intervals.
Use additional points: if enabled, and if additional points have been specified as strings (see below), these points will be used in the creation of new surfaces and volumes. This applies to hanging wall points, foot wall points, trend surface points and full intervals.
If disabled,
no additional points will be used during surface generation, regardless
of the other settings in this section.
For example: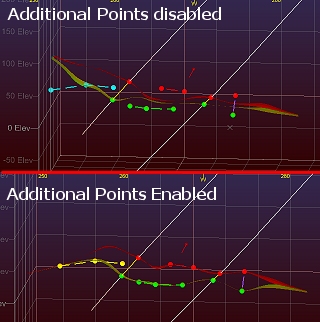
Strings: all additional
HW, FW and Trend surface points are digitized as string data.
Select an object from the drop-down list to be used to store the
new string data, or leave blank to automatically create a new
string object containing additional points for vein modelling.
If no current strings object exists, one will be created with the
name in the format "Add_Points_<Drillholename>".
All additional point types will be stored in the selected string
object; hanging wall points, foot wall points, trend surface points
and full intervals.
These points will only be used in surface/volume creation if Use additional points (see
above) is enabled, and these points are associated with the current
Column/Value pair. You
can store additional points for multiple Column/Value
combinations in the same string object.
Add
Points:
you can add HW, FW, interval or trend surface data:
To add extra HW, FW, trend or interval data to a vein modelling scenario:

-
Digitize a new string containing vertices representing hanging wall points. These will be considered with the currently loaded drillhole positive samples (FROM positions) to generate a hanging wall surface or upper surface of a combined volume. As with any string data, you can condition your design to introduce more points, edit points, delete points etc.; any string editing function can be applied to hanging wall string data. Data will be output to the object selected in the Strings drop-down list (see above).
-
Digitize new foot wall data points. As above, this is specified as a string and can be treated as any other string data. (Create Vein Surfaces only)
-
Digitize intervals. The first point will be a HW point and the final point a FW point. Any number of vertices can be digitized in between. (Create Vein Surfaces only)
-
Digitize trend points; introduce new points into the trend surface with this option. (Create Vein Surfaces only)
-
Add Selected String Data as HW Points: only available if string data is selected in the 3D window. Selecting this option will convert the selected data to additional hanging wall points. This feature is particularly useful, for example, if you have imported face map data and wish to include digitized/sketched contacts in your structural model. (Create Vein Surfaces only)
-
Add Selected String Data as FW Points: only available if string data is selected in the 3D window. Adds selected data as footwall additional points. (Create Vein Surfaces only)
Control how the edge(s) of your calculated surface or volume are constrained, using either a manually-defined perimeter (string) object or an automatic/calculated method.
Auto: constrain the edge(s) of your surface or volume, including both external and internal edges, using a calculated option. Choose from one of the following:
-
Alpha shape: use a specified segment length to determine the alpha shape of the exterior hull. Depending on the specified Segment length, a more or less generalized outline will be produced. You can then increase the material boundary by expanding this shape using the Extension Distance field.
-
Aligned Square: use a bounding cuboid to restrict the surface hull. The cuboid hull will include all positive samples and will be extended beyond this by the defined Extension distance.
Custom: use a perimeter string object (containing one or more closed strings) to limit the boundary of your generated data. Clipping perimeters are stored as a strings object. If one already exists, you can select it from the drop-down list.
Either select an existing strings object, or leave the list empty to generate a new perimeter object and then either:
-
Digitize a new perimeter string using the
 icon: if no string object is selected, a new object will be
created (prefixed with "Boundary_" followed by the
current Drillholes
data object name. Only closed perimeters can be created by
defining the vertices of the polygon.
icon: if no string object is selected, a new object will be
created (prefixed with "Boundary_" followed by the
current Drillholes
data object name. Only closed perimeters can be created by
defining the vertices of the polygon. -
Select an existing closed string to add to an existing or new perimeter object. Select
 and choose a closed string or strings in any
3D window, then click Add to add the data to the new or existing
perimeter object. The number of perimeters currently selected
is shown, and updated as string selections are made/changed.
and choose a closed string or strings in any
3D window, then click Add to add the data to the new or existing
perimeter object. The number of perimeters currently selected
is shown, and updated as string selections are made/changed.
Proto: select any loaded block model or block model prototype object using the drop-down list. Your output surface or volume will be bounded by the outer cuboid hull of the selected model.
The above options are explained in more detail in Boundary Clipping.
These functions relate to the definition of fault data for modelling.
Use Faults: if selected, and a valid fault wireframe and Fault ID Column (see below) is selected, output data will generate independent fault blocks for each distinct area created by fault wireframes. If disabled, no faulting will be applied, regardless of other selections.
Fault Surfaces: select a loaded wireframe object containing one or more fault wireframes. More...
Fault ID Column:
select an attribute within the selected fault surface (see above) representing
unique fault wireframes. If <none> is selected, the full wireframe
file will be treated as a single faulting structure.
Once a Fault ID column has been selected, the loaded fault wireframe will
update automatically to highlight the different Fault ID values within
the selected attribute.
|
|
A minimum qualifying number of positive sample points must exist in each output fault area in order to model a fault block. The number required depends on the modelling method in use. Use the link below for more information. |
Automatically extend faults: if fault wireframes do not extend beyond the outer edge of modelled volume data, selecting this check box will force all faults within the selected fault wireframe to be extendedall the way to the data boundary.
This option should be used with caution, as if faults intersect within the data, say, they terminate on other faults as result of more complex geological displacement, those faults will continue through the data on both sides of the fault being intersected, out to the boundary. This could, potentially, introduce unexpected/unwanted faulting.
Manage how inter-sample data is calculated to form HW and/or FW surface data.
Min. Thickness: This setting controls how the generated structure will be calculated with regards to a minimum thickness setting. These settings are only valid if Pinch out has been selected and both HW and FW surfaces are generated.
More about thickness control...
There are two possible modes for this control:
-
Expand To: if enabled, this encourages/forces continuity between positive sample points (notwithstanding the subsequent effect of negative samples, which is applied afterwards). Specify the minimum possible thickness for the generated structure; if the structure is calculated to be mathematically thinner, the resulting structure is forcibly expanded to the value set, which is useful for forcing continuity between widely-separated points and/or very short seam-like intervals. Higher values tend to increase volume.
-
Remove Below: if selected, specify the minimum permitted thickness permitted for the generated structure before pinching out. Lower values tend to increase volume. This is the default setting.
(Identical to Wireframes from Drillholes dialog
Max. Thickness: prevents unwanted swelling of the) lode where sample points are widely-separated and sparse. This is the maximum thickness of the vein that is allowed, and HW and FW surfaces will both be modified in order to limit a thicker volume.
More about thickness control...
Boundary
Thickness: if using an automated boundary
clipping option (Alpha Shape,
Aligned Square) or a
Custom boundary string
you can choose how your external volume boundary is shaped with
this control. For more conservative volumes, you can constrain
the thickness of the lode model at the boundary to a specified
distance. The boundary will be constrained to this distance if,
without any constraint, it would be a greater distance.
This setting can only be used to reduce the thickness of the volume
at the periphery; volumes will not be expanded to a value that
is greater than the unmodified shape.
More about thickness
control...
Resolution:
choose to create a [Very low], [Low], [Medium], [High] or [Very
High] resolution surface or volume.
|
|
Increasing the density of triangles in the resulting wireframe will increase calculation times exponentially. Start with a low Resolution to get a rough idea of the outcome then increase to refine the final structure. |

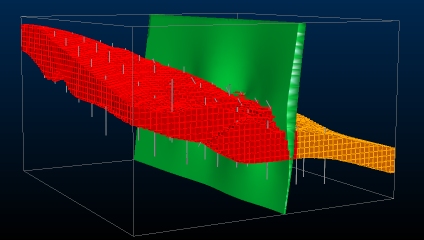
Pinch Out: select this to create
voids where HW and FW surfaces converge or invert, or fall within
the specified Minimum
Thickness value if Remove Below
is enabled (see above).
Decide which data is output by the vein-from-samples command.
Generate: choose if you wish to output a Hanging wall or Foot wall surface, or Both as a combined volume suitable for cell modelling and evaluation. If Both is selected, and Pinch Out is enabled (see above), surface data will be removed/pinched out if the HW and FW surface overlap.
Vein Surface: this is the name of the resulting in-memory object (either one or two surfaces, or an enclosed volume). You can select to overwrite any existing object using the drop-down list.
A default name is constructed based on the current column and value select, using a standard prefix "VeinSurf", e.g. "VeinSurf_NLITH_3".
If an output object with the same name already exists, a further index number will be appended, e.g. "VeinSurf_NLITH_3 (2)" and so on in increasing index number order. You cannot overwrite existing object data.
Trend Surface: select this to generate a surface representing the mid points of HW and FW surface positions throughout the positive set.
The trend surface is not affected by additional points (HW or FW) but additional Trend points can be added to influence its shape. More about additional points...
A default name is constructed based on the current column and value select, using a standard prefix "VeinTrend", e.g. "VeinTrend_ZONECODE_844". As above, an index suffix will be applied if an object of the same name already exists.
Boundary: select an existing
string object, or enter the name of a new one and enable the Boundary
check box to automatically generate a string representing the
hull of the generated vein surface or volume. Generate the boundary,
make edits to it using any of the available string editing tools,
then select the modified strings as a Custom boundary for
more intricate edits to the boundary shape in subsequent vein
computations.
More about boundary
options...
Recompute: generate the implicit surface(s) selected above (output vein model and/or trend surface) overwriting an existing object if one of the same name is already loaded. This button is only enabled if all required modelling parameters are specified.
If the <Batch> option is selected and multiple attribute values are modelling, Recompute will output all surfaces for all values into the chosen object, overwriting one of the same name if it exists.
If an object of the specified name does not exist, a new object will be generated (i.e. the same behaviour as Compute New - see below).
Compute New: generate the implicit surfaces selected above, generating a new object. If the name of either the output model or trend surface already exists, a suffix will be added to create a new object name. This button is only enabled if all required modelling parameters are specified.
If the <Batch> option is selected and multiple attribute values are modelling, Recompute will output all surfaces for all values into a new object, automatically suffixing the current name if an object of the same name is already loaded.
|
|
Vein models output using the batch option will be colored according to the default legend for the selected modelling attribute (Column). |
Batch Settings: only available if the <Batch> Value option is selected, this opens the Batch Settings for Veins dialog to allow you to pick which value(s) you wish to model as part of batch processing. More...
Reset: reset the current settings for the current Column/Value combination to default settings.
Copyright © Datamine Corporate Limited
JMN 20045_00_EN