
Assign Project Overlays
This is the sixth of a series of activities relating to field map reporting configuration.
Warning: This topic is intended for Studio Mapper system administrators. You should not attempt any of the following procedures unless you are confident to do so, and are familiar with the concepts described.
This topic assumes some familiarity with the Plots window and Plots window templates.
To filter projections to show only one or a group of map data types (image, sketches, features etc.) but not all map data available for the target projection, you will have already set up projection reference objects.
If you don't plan to filter specific projections to only display overlays for certain data types. you can skip this section.
Warning: updating the system configuration file will affect all Studio Mapper projects with which it is associated. Changes should only be made if you are familiar with the XML format, and changes should be tested in an appropriate environment before rolling out to a live system.
To filter projections to only display specific data types:
-
Display the plot template you wish to use to configure PDF reports.
-
Open the Project Data control bar (if it is not displayed, use the Setup ribbon's Show menu to enable it).
-
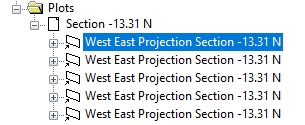
Expand the Plots folder, and the sub-folder representing your template. In the example, below, "Section-13.31 N" is expanded to show 5 projections (four face projections and one 3D projection). The names of each projection aren't relevant and yours will be different (each projection references a section with in a section definition table, or a 3D projection setup):
-
You can find out which section relates to which projection by enabling Page Layout mode (Manage ribbon >> Layout Mode) and left-clicking a projection to display the resizer bars for that item.
-
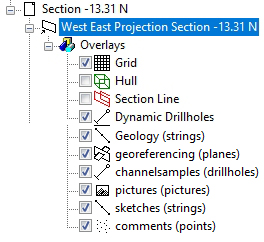
Find the projection you wish to filter and expand it to reveal the Overlays it currently contains.
An overlay appears for all default plot projection items (Grid, Hull, Section Line, Dynamic Drillholes and "map_faces") and you will also see an overlay for each data type the projection containse.g.:
-
At this point, for each projection, you can either:
- always include all available and displayed map data in the projection, in which case delete all overlays (using right-click and Delete) that relate to map data types. Don't delete the other default objects.
-
pick specific data types to appear in the target projection (e.g. just the image, or the image plus sketches only etc.). In this case remove all object overlays that represent the data you don't want to see in your report, leaving a subset of the ones you want.
For example, leaving only the "map_pictures" overlay, the target projections of a sheet will only show map pictures data and nothing else.
Note: If you delete an overlay accidentally, you can re-add it by right-clicking the relevant Overlays folder and using the Insert function to access the 3D Object Overlay Wizard.
Next, see Save and Test Report Template.