|
|
Project Activities Data Grid Viewing summary information about your planning project |
Project Activities

Accessing this panel:
-
Display the Planning Reports panel and click Show Data Grid.
The Project Activities panel is used to show summary planning information for the current underground project, on an activity-by-activity basis.
By default, a 'flat' structure is displayed that lists all sequenced activities by their identifier (Id) and a list of all attributes that support them. This includes both system attributes, such as Segment Number, XYZ coordinates of the activity point in 3D space plus calculated fields such as Area, Insitu_Volume, Insitu_Mass etc. User-defined attributes are also listed, as configured using the Edit Attributes panel.
|
|
You can also pivot your schedule table results, using the Activities Pivot Table report panel. |
You can categorize your information using one or more grouping attributes. This is done by left-clicking and dragging a table column to the top of the panel and releasing the mouse button. This will allow you to set up primary, secondary and more detailed grouping.
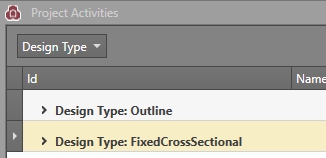
For example, you may wish to group your activities by design type;
dragging the Design Type table column to the top of the panel groups
the table into design type categories which can be expanded to show
the categorized information, e.g.:
You can sort the categories alphabetically (ascending or descending order) using the button provided.
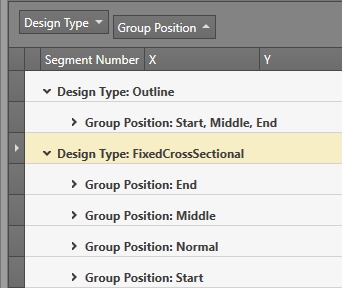
Continuing the above example, you could sub-categorize each design
type into Group Position categories by dragging the Group Position
attribute to the top of the panel. This triggers secondary grouping.
Expanding the Design Type categories then reveals secondary options
e.g.:
You can use whichever grouping methods you want although you should be wary of selecting, say, a numeric column such as length or area as a grouping item as this may produce a high level of sub-categories.
|
|
You can alter the order of any data column by dragging it left or right in the table. This facility extends to grouping buttons; editing the position of grouping buttons will change sorting order precedence and update the table automatically. |
You can also export your table information to a comma-delimited file (.csv) using the Export to CSV option, although this will disregard existing groupings if any exist.
When you've finished reviewing your schedule information, click Cancel to return to the Planning Reports panel.
Project Activities Table
The Project Activities table contains the following fields. It may contain additional grouping buttons if grouping has been applied. The ordering of data columns is user-definable so the following information lists the default left-right order,and only describes system attributes.
Id: the unique reference for a schedule activity, as represented by the generated solids file ACT_ID attribute.
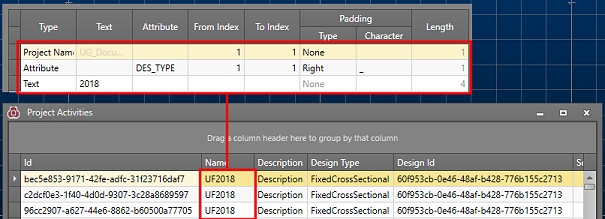
Name:
the Name column is set up
as part of your current Naming Convention.
Each activity will be assigned a name according to whether is passes
a particular Filter, or if no filter is set, the naming convention
will be applied to all activities. Quite often, one or more elements
of a naming convention will be dynamic; for example, if design data
is represented by a particular LEVEL field, it could be used within
the activity name to give it a useful context. This could be coupled
with an activity segment number (SEG_NUM) and/or design type (DESIGNDF)
to provide a unique activity reference (although the Name doesn't
have to be unique; the Id is the unique identifier for an activity
and is stored in the ACT_ID column in the generated solids output
triangles file).
More about naming conventions...
Description:
the description of an activity is defined as part of the Design
Definitions for the project. Once a Design Definition has been
'connected' to a design element, the description used for the design
definition will also be associated with the activity.
More about Design Definitions...
Design Type:
this column describes the design type associated with the activity,
which will be either FixedCrossSection,
Outline, ComplexSolids,
Derived or Wireframe.
More about the Fixed Cross Section
design type...
More about the Outlines design type...
More about the Complex Solids design type...
More about the Wireframes design type...
Design Id: a unique reference for the distinct design data entity within the file to which the activity belongs. Multiple activities can share the same Design Id (i.e. there are multiple activity points within the design element).
Segment Number: for segmented design types, this represents the sequence number of the segment of data to which an activity is associated. Multiple segment numbers can exist for any given activity, but each Design Id / Segment Number combination will be unique for an activity Id.
XY/Z: the location of the activity point in 3D space.
User attributes: any number of user-defined attributes and corresponding values can appear at this position in the table.
Calculated fields: calculated fields are shown at the right of the table by default (this can be changed by dragging/dropping) and can include the following:
Insitu_Volume
Insitu_Mass
Density (this may not be calculated but specified)
Mined_Volume
Void_Volume
Depleted_Volume
Export to CSV: export an ungrouped comma-delimited file containing all items listed in the table. The column order of the current table is preserved in the output .csv file. All columns are exported.
|
|
Related Topics |
|
|
Edit
Naming Conventions
Edit Attributes Edit Design DefinitionsActivities Pivot Table |
Copyright © Datamine Corporate Limited
JMN 20045_00_EN

