
Evaluation Results
To access this screen:
-
Launch any of the following commands:
After setting initial parameters, the
Evaluation Results window
is displayed.
This panel is a streamlined version of the one shown using dynamic evaluation commands. Results for TONNES and VOLUME will always be displayed alongside the relevant BLOCKID. If additional fields were selected for evaluation, such as PHASE, SEQUENCE, VALUE, average AU grade etc. these will also be shown for each table record.
The Table View consists of three data windows showing the various categories (a category relates to an interval in an evaluation legend, as selected on the settings screen - more information about evaluation legends can be found in your Legends Help File). For each evaluation category a table record row is displayed showing the results of the standard and additional model fields.
This data relates to all selected string data in the 3D window, regardless of whether the individual evaluation data (strings or wireframe) belong to a single object, or multiple objects.
The Table View screen comprises the following components:
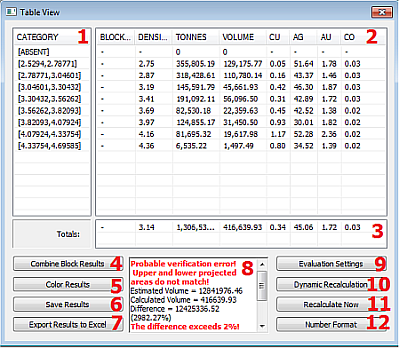
| 1 | Category Table | Displays legend intervals defined in the current evaluation legend, as selected on the Evaluation Settings screen. Each item in this list will have a corresponding row in the Grade Columns Table (see below). |
| 2 | Grade Columns Table |
System and user-defined grade columns (if selected on the Evaluation Settings screen) are listed. Each record corresponds to a particular evaluation category, as seen in the Category list and shows evaluation results for each of the selected grade fields. Note: If Combine Block Results is checked, and more than one string is selected, a single set of results will be displayed (with no BLOCKID) showing the compound results for all selected evaluation strings. If unchecked, a separate group of results, each with a unique block identifier, will be listed. It is the view in this and the Category field that are stored in a results file, if you elect to save one. |
| 3 | Totals |
A summary total for all evaluation categories, for each grade column, is shown in this section of the dialog. |
| 4 | Combine Block results |
This toggle is effective when more than one evaluation string has been defined and is selected. If checked, the Grade Fields Table display a single group of records denoting the combined evaluation for each legend category. If unchecked , distinct groups of data (each representing a particular evaluation block) are listed. In the latter situation, a block identifier is listed in the results file to denote the source of the evaluation results. |
| 5 | Colour Results |
By default, text in the Grade Columns Table is rendered in black. To assist in the interpretation of the data and determine whether results are within the required range, it is possible to use a colour table to automatically colour the results. Displays the Choose a Color Table screen. |
| 6 | Save Results |
Click to save the contents of the current Grade Columns Table to a results table in memory, using the Save Evaluation Results screen. This table will then be listed in the Loaded Data control bar and can be saved either with the project, or as a separate Datamine file. |
| 7 | Export Results to Excel | Launch Microsoft Excel and display the Category and Grade Column tables. |
| 8 | Calculation Results | The estimated vs. calculated values, and lists the discrepancy. For all discrepancies above 2%, a warning will be shown, listing possible reasons for the difference in values. For more information on interpreting the summary data, see Dynamic Evaluation Reports Overview. |
| 9 | Evaluation Settings | Click to display the Dynamic Evaluation Settings screen, where you can specify how evaluation is performed, and according to which evaluation legend or grade fields. |
| 10 | Dynamic Recalculation |
if checked, the contents of the Grade Columns Table (see above) are updated on the completion of an evaluation string editing function (move points, move string section, insert points and so on). Note: If checked, results are updated immediately after each edit. |
| 11 | Recalculate Now | If Dynamic Recalculation is inactive (see above), manually recalculate the values of the Grade Columns Table. |
| 12 | Number Format |
Display the Number Format screen to specify the use of a thousands separator and select the number of digits after the decimal point using the Digits after decimal list. Values from [0] to [10] are available, as well as [Auto] which selects the default of 8 decimal places. |
Note: For more information on dynamic evaluation reports, particularly how the data is displayed in this dialog, please refer to Dynamic Evaluation Reports.
Related topics and activities