
CHART Process
To access this process:
- View the Find Command screen, select CHART and click Run.
- Enter "CHART" into the Command Line and press <ENTER>.
See this process in the Command Table.
Process Overview
Note: This is a superprocess and running it may have an effect on other Datamine files in the project.
This process transforms data into a suitable format for creating charts and optionally creates and displays a draft quality plot.
The input data file may include up to three levels of key fields. In this way multiple information can be displayed on a single chart. The output file OUT contains the chart data and the file PLOT contains the plot file. At least one of these two files must be specified.
The output plot file PLOT is created using the batch graphics processes and can therefore only be considered as draft quality. The output file OUT can be exported and can be used in Excel or a charting package to produce high quality plots.
Note: CHART is a legacy process. Your product provides a wide range of interactive charting tools that work with loaded data objects. See Creating and Editing Histograms, Create and Edit Scatter Plots or search for "Charts".
Plot Size and Scaling
Size and scaling information can be defined using an input plot prototype file, as created using PROTOP. Alternatively, the values can be specified using the parameters XPAPER, XMIN, XMAX, XSCALE for X and similarly for Y. If the minimum, maximum and scaling parameters are undefined then suitable defaults will be calculated automatically. The default plot size is 240x200mm.
Scattergram
A scattergram is simply a plot of a symbol at each X,Y point.
For example, data file sample1 is a desurveyed drillhole file containing fields AU, CU, ROCK and , where has been assigned according to the ROCK value. A scattergram will show the relationship between the AU and CU values.
To add a legend in the bottom right corner we will need to make the following changes:
|
Type |
Name |
Value |
|
Field |
KEY1 |
ROCK |
|
Parameter |
LEGEND |
2 |
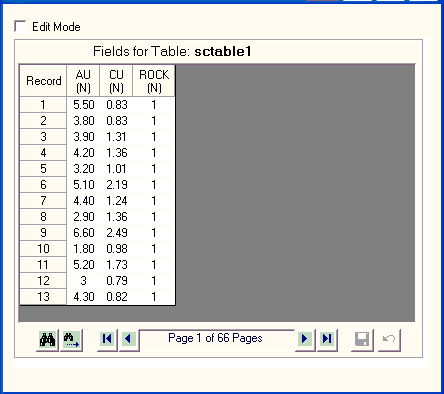
By specifying a key field the plot will use the different symbols for each key field combination. SYMBOL1=92 so the + symbol will be plotted for the first key field combination (ROCK=1). SYMBOL2=0 so different symbols will be plotted for the second and subsequent key field combinations (only two key fields in this example), starting with the value of SYMBOL1 plus 1 ie 93 which is the X symbol.
The output file sctable1 includes the key field and the X and Y fields. The output file is really only useful if a probability scale (eg XTRANS=4) or a histogram (CHARTTYP=3) have been selected.
If you want to define your own title and axis annotation then you should specify an ANNO file. This contains the three fields XANNO, YANNO and TITLE which should be alpha fields with a maximum of 40 characters.
Line Chart
A good example of a line chart is an experimental variogram. If vgram1 is the output file from the variogram calculation process VGRAM, then the variograms for different azimuths can be displayed.
Probability Plot
One way to test whether a set of data conforms to a Normal distribution is to create a normal probability plot. This is a plot of grade against cumulative probability where the scaling on the probability axis is constructed in such a way that a Normal distribution appears as a straight line.
The OUT file includes the following fields, sorted on ROCK and AU:
|
Field |
Description |
|
ROCK |
KEY field |
|
|
The field |
|
AU |
The log of the selected grade field |
|
PHI |
Standard normal distribution value |
|
CUMPROB |
Cumulative probability % |
To test whether the samples conform to a Lognormal distribution, make the following change:
|
Type |
Name |
Value |
|
Parameter |
XTRANS |
2 |
The X axis is then plotted using a logarithmic scale. If the samples conform to a Lognormal distribution the plots will be straight lines.
Histogram
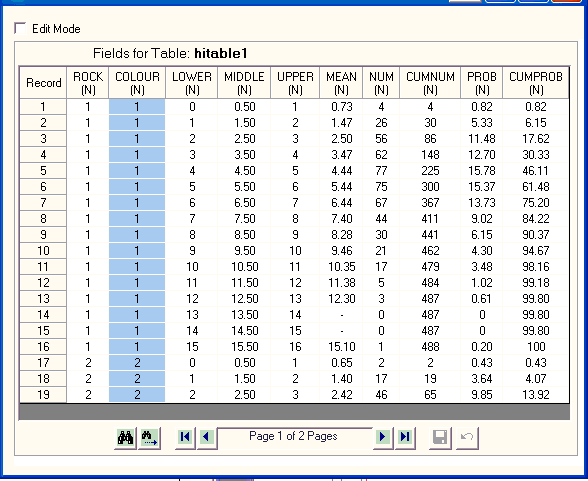
The following chart example shows AU histograms for the two ROCK values displayed on the same plot.
Selecting HISTTYP=1 (bin plot) is probably not the best way of displaying two histograms simultaneously. Selecting HISTTYP=3 (line plot) would be better:
|
Type |
Name |
Value |
|
Parameter |
HISTTYP |
3 |
The OUT file includes the following fields, sorted on ROCK and LOWER:
|
Field |
Description |
|
ROCK |
KEY field |
|
|
The field |
|
LOWER |
Lower bin value |
|
MIDDLE |
Mid bin value |
|
UPPER |
The log of the selected grade field |
|
MEAN |
Mean grade within bin |
|
NUM |
Number of samples within bin |
|
CUMNUM |
Cumulative number of samples up to and including current bin |
|
PROB |
% probability in bin |
|
CUMPROB |
Cumulative % probability up to and including current bin |
in order to calculate the log histogram change the XTRANS parameter:
|
Type |
Name |
Value |
|
Parameter |
XTRANS |
2 |
Reserved Field Names
Field names that are created in the output file OUT cannot be used as input fields for X, Y, WEIGHT, KEY1, KEY2, KEY3. The reserved field names are LOWER, MIDDLE, UPPER, MEAN ,NUM, CUMNUM, PROB, CUMPROB and PHI.
Input Files
|
Name |
Description |
I/O Status |
Required |
Type |
|
IN |
Input data file. |
Input |
Yes |
Table |
|
PROTO |
Plot prototype file. Must contain the fields X, Y, S1, S2 and CODE (numeric, explicit) and XMIN, XMAX, YMIN, YMAX, XSCALE, YSCALE (numeric, implicit). |
Input |
No |
Plot Prototype |
|
ANNO |
Input file containing annotation for plot axes and title. Must contain the fields XANNO, YANNO and TITLE (alpha, explicit). The file should only include one record. |
Input |
No |
Table |
Output Files
|
Name |
I/O Status |
Required |
Type |
Description |
|
OUT |
Output table. If CHARTTYP =3 this will be a histogram table. Otherwise the table will contain fields suitable for creating a plot. At least one output file ( PLOT or OUT ) must be specified. |
Output |
No |
Table |
|
PLOT |
Output plot file. At least one output file ( PLOT or OUT ) must be specified. |
Output |
No |
Plot |
Fields
|
Name |
Description |
Source |
Required |
Type |
Default |
|
X |
Field in input file IN to be plotted along the X axis. Not required if probability is to be plotted along the X axis XTRANS =4. |
IN |
No |
Numeric |
Undefined |
|
Y |
Field in input file IN to be plotted along the Y axis. Not required if probability is to be plotted along the Y axis YTRANS =4. |
IN |
No |
Numeric |
Undefined |
|
WEIGHT |
Weighting field in input file IN . Only applicable if histogram ( CHARTTYP =3) has been selected. |
IN |
No |
Numeric |
Undefined |
|
KEY1 |
First key field in the input IN file. |
IN |
No |
Numeric |
Undefined |
|
KEY2 |
Second key field in the input IN file. |
IN |
No |
Numeric |
Undefined |
|
KEY3 |
Third key field in the input IN file. |
IN |
No |
Numeric |
Undefined |
Parameters
|
Name |
Description |
Required |
Default |
Range |
Values |
||||||||||||||||||||
|
CHARTTYP |
Type of chart. Default (1).
|
No |
1 |
1, 3 |
1,2,3 |
||||||||||||||||||||
|
HISTTYP |
Type of histogram - only used if CHARTTYP =3:
|
No |
1 |
1,4 |
1,2,3,4 |
||||||||||||||||||||
|
BINSIZE |
Histogram bin size - only used if CHARTTYP =3. If a log histogram is selected then the bin size should still be specified in non-transformed units. The process will then recalculate the bin size, so as to create the same number of bins as the normal histogram. |
No |
1 |
Undefined |
Undefined |
||||||||||||||||||||
|
BINMIN |
Minimum grade for histogram calculation ( CHARTTYP =3). If the grade is less than the minimum and BINMETH =1 the sample will be ignored. If the grade is less than the minimum and BINMETH =2 the sample will be assigned to the bottom bin. |
No |
0 |
Undefined |
Undefined |
||||||||||||||||||||
|
BINMAX |
Maximum grade for histogram calculation ( CHARTTYP =3). If the grade is greater than or equal to the maximum and BINMETH =1 the sample will be ignored. If the grade is greater than or equal to the maximum and BINMETH =2 the sample will be assigned to the top bin. If undefined then the maximum value will be set to the maximum sample value. |
No |
Undefined |
Undefined |
Undefined |
||||||||||||||||||||
|
BINMETH |
Bin selection method for histogram calculation ( CHARTTYP =3):
|
No |
1 |
1,2 |
1,2 |
||||||||||||||||||||
|
XTRANS |
Transform to be applied to data values plotted on X axis. Default (1).
|
No |
1 |
1,4 |
1,2,3,4 |
||||||||||||||||||||
|
YTRANS |
Transform to be applied to data values plotted on Y axis. Default (1).
|
No |
1 |
1,4 |
1,2,3,4 |
||||||||||||||||||||
|
LOGMIN |
If X or Y values are less than LOGMIN they are reset to this value before a log transform is applied. This is only relevant if XTRANS or YTRANS are set to 2 or 3. Default (0.01). |
No |
0.01
|
0.0000001,999999
|
|
||||||||||||||||||||
|
FRAMETYP |
This parameter defines the type of frame for the plot:
|
No |
2 |
0,2 |
o,1,2 |
||||||||||||||||||||
|
XFACTOR |
Dividing factor applied to X values before any transform using XTRANS . Default (1). |
No |
1 |
|
|
||||||||||||||||||||
|
YFACTOR |
Dividing factor applied to Y values before any transform using YTRANS . Default (1). |
No |
1 |
|
|
||||||||||||||||||||
|
LINETYP1 |
Line type to be used for first key field combination. Default (1). Line Types:
|
No |
1 |
1,6 |
1,2,3,4,5,6 |
||||||||||||||||||||
|
SYMBOL1 |
Plotted symbol at each point for first key field combination. Default (92).
|
No |
92 |
91,98 |
91,92,93,94,95,96,97,98 |
||||||||||||||||||||
|
SYMSIZE1 |
Symbol size in millimetres for first key field combination (3). Set to 0 for no symbol. |
No |
3 |
Undefined |
Undefined |
||||||||||||||||||||
|
COLOUR1 |
Line and symbol colour number for first key field combination (1). |
No |
12 |
Undefined |
Undefined |
||||||||||||||||||||
|
LINETYP2 |
Line type to be used for second and subsequent key field combinations. Default (0). Line Types:
|
No |
0 |
0,6 |
0,1,2,3,4,5,6
|
||||||||||||||||||||
|
SYMBOL2 |
Plotted symbol at each point for second and subsequent key field combinations. Default (0).
|
No |
0 |
0,98 |
0,91,92,93,94,95,96,97,98 |
||||||||||||||||||||
|
SYMSIZE2 |
Symbol size in millimetres for second and subsequent key field combinations (3). Set to 0 for no symbol. |
No |
3 |
Undefined |
Undefined |
||||||||||||||||||||
|
COLOUR2 |
Line and symbol colour number for second and subsequent key field combinations. Set to (0) for different colours for different key field combinations. |
No |
|
|
|
||||||||||||||||||||
|
APPEND |
Plot append flag. Default (0):
|
No |
0 |
0,1 |
0,1 |
||||||||||||||||||||
|
COLFLAG |
Colour flag. Default (1).
|
No |
1 |
0,1 |
0,1 |
||||||||||||||||||||
|
LEGEND |
Flag to show if legend is required and legend position. Default (0).
|
No |
|
0,4 |
0,1,2,3,4 |
||||||||||||||||||||
|
LEGCHSIZ |
Legend character size (3). |
No |
3 |
Undefined |
Undefined |
||||||||||||||||||||
|
TCHARSZ |
Title character size in mm. |
No |
3 |
Undefined |
Undefined |
||||||||||||||||||||
|
TCOLOUR |
Title colour. |
No |
12 |
Undefined |
Undefined |
||||||||||||||||||||
|
XINC |
Grid increment on X axis. Not used if one of the axes has a probability scale. |
No |
Undefined |
Undefined |
Undefined |
||||||||||||||||||||
|
YINC |
Grid increment on Y axis. Not used if one of the axes has a probability scale. |
No |
Undefined |
Undefined |
Undefined |
||||||||||||||||||||
|
NDX |
Number of decimal places for annotation on X axis. If undefined then an appropriate number will be calculated automatically. |
No |
Undefined |
0,6 |
0,1,2,3,4,5,6 |
||||||||||||||||||||
|
NDY |
Number of decimal places for annotation on Y axis. If undefined then an appropriate number will be calculated automatically. |
No |
Undefined |
0,6 |
0,1,2,3,4,5,6 |
||||||||||||||||||||
|
IGRID |
|
No |
3 |
-20,20 |
Undefined |
||||||||||||||||||||
|
FCHARSZ |
Frame character size in mm. |
No |
3 |
Undefined |
Undefined |
||||||||||||||||||||
|
FCOLOUR |
Frame colour. |
No |
12 |
Undefined |
Undefined |
||||||||||||||||||||
|
XPAPER |
Paper size in mm in X direction. |
No |
240 |
Undefined |
Undefined |
||||||||||||||||||||
|
YPAPER |
Paper size in mm in Y direction. |
No |
200 |
Undefined |
Undefined |
||||||||||||||||||||
|
XMIN |
Minimum value of X for plot. In order for this value to be used two parameters from XMIN , XMAX , and XSCALE and two parameters from YMIN , YMAX , and YSCALE must be specified. |
No |
Undefined |
Undefined |
Undefined |
||||||||||||||||||||
|
XMAX |
Maximum value of X for plot. In order for this value to be used two parameters from XMIN , XMAX , and XSCALE and two parameters from YMIN , YMAX , and YSCALE must be specified. |
No |
Undefined |
Undefined |
Undefined |
||||||||||||||||||||
|
YMIN |
Minimum value of Y for plot. In order for this value to be used two parameters from XMIN , XMAX , and XSCALE and two parameters from YMIN , YMAX , and YSCALE must be specified. |
No |
Undefined |
Undefined |
Undefined |
||||||||||||||||||||
|
YMAX |
Maximum value of Y for plot. In order for this value to be used two parameters from XMIN , XMAX , and XSCALE and two parameters from YMIN , YMAX , and YSCALE must be specified. |
No |
Undefined |
Undefined |
Undefined |
||||||||||||||||||||
|
XSCALE |
X scale in user data units per millimetre. In order for this value to be used two parameters from XMIN , XMAX , and XSCALE and two parameters from YMIN , YMAX , and YSCALE must be specified. |
No |
Undefined |
Undefined |
Undefined |
||||||||||||||||||||
|
YSCALE |
Y scale in user data units per millimetre. In order for this value to be used two parameters from XMIN , XMAX , and XSCALE and two parameters from YMIN , YMAX , and YSCALE must be specified. |
No |
Undefined |
Undefined |
Undefined |
||||||||||||||||||||
|
PROGRESS |
Flag to control amount of output written to Output Window (1).
|
No |
1 |
0,1 |
0,1 |
||||||||||||||||||||
|
DISPLAY |
Flag to select whether or not to display plot file.
|
No |
1 |
0,1 |
0,1 |
Related topics and activities