|
|
Chart Wizard Editing the display properties of an existing optimization chart |
Chart Wizard

To access this dialog:
-
In a project with at least one chart, activate the Optimization ribbon and select Charts | Options.
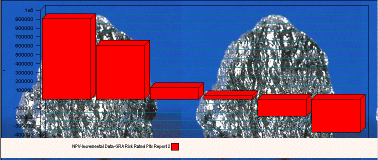
This wizard is shown when you are editing the properties of an existing chart, previously inserted into your project. Fields are set out in a series of categorized tabs, across the top of the dialog. Optimization charts (not to be confused with general histogram, scatter plot and line charts) are comprised of a minimum of four basic components; A title, the display area, a legend and a label. Formatting can be set independently for these components on each of the available tabs.
More about chart types in Studio NPVS...
General, Fill Style and Font Style tabs
Setting of: choose the chart element to be formatted here. The following chart elements are available:
- Title_A: the primary
title of the chart, shown as a subtitle to the chart, positioned
at the top.
General Parameters available: Measure, Border, Component Rect, Shadow, Chart Title.
Fill Style Parameters available: Fill style, Angle value, Resource fill, Start/End Color.
Font Style Parameters available: Type name, Size, Bold/Underline/Italic/Strike out, Font color, Alignment - Display_B: represents
the main chart data display area. These parameters control how
your optimization data is displayed.
General Parameters available: Measure, Border, Component Rect, Shadow, Scope, Chart, Axis, Show zero, Relative Index, X/Y grid, X/Y ticks, Max size
Fill Style Parameters available: Fill style, Angle value, Resource fill, Start/End Color.
Font Style Parameters available: Type name, Size, Bold/Underline/Italic/Strike out, Font color, Alignment - Decimal scale_C:
the general formatting used for the horizontal axis at the bottom
of the chart.
General Parameters available: Measure, Border, Component Rect, Shadow
Fill Style Parameters available: Fill style, Angle value, Resource fill, Start/End Color.
Font Style Parameters available: Type name, Size, Bold/Underline/Italic/Strike out, Font color, Alignment - Decimal scale_D:
the general formatting used for the vertical axis of the chart.
General Parameters available: Measure, Border, Component Rect, Shadow
Fill Style Parameters available: Fill style, Angle value, Resource fill, Start/End Color.
Font Style Parameters available: Type name, Size, Bold/Underline/Italic/Strike out, Font color, Alignment - Label_E: an arbitrary
chart label, commonly relating to [Decimal scale_C] but can be
positioned anywhere.
General Parameters available: Measure, Border, Component Rect, Shadow
Fill Style Parameters available: Fill style, Angle value, Resource fill, Start/End Color.
Font Style Parameters available: Type name, Size, Bold/Underline/Italic/Strike out, Font color, Alignment - Label_F: an arbitrary chart label,
commonly relating to [Decimal scale_D] but can be positioned anywhere.
General Parameters available: Measure, Border, Component Rect, Shadow
Fill Style Parameters available: Fill style, Angle value, Resource fill, Start/End Color.
Font Style Parameters available: Type name, Size, Bold/Underline/Italic/Strike out, Font color, Alignment - Legend_G: the chart
legend.
General Parameters available: Measure, Border, Component Rect, Shadow, Scope, Legend Style, Rect Lock, Key Style/Size, Rows/Columns.
Fill Style Parameters available: Fill style, Angle value, Resource fill, Start/End Color.
Font Style Parameters available: Type name, Size, Bold/Underline/Italic/Strike out, Font color, Alignment
Misc Parameters:
Set the order that graph items are drawn to graph, allowing some items to sit 'behind' others if required.
Copyright © Datamine Corporate Limited
JMN 20065_01_EN


