
Legacy Charts
Charts of various types can be added to your project. Chart functionality comes in different types:
-
Legacy optimization workflow charting introduced several years ago (in NPVS, a predecessor product). This functionality is retained for legacy project support reasons.
-
Modern optimization workflow charting tools, as described here.
-
Core system charting tools, available in all Studio products and not specific to the optimization workflow. You can access these charts using the Report ribbon.
Note: Output data from the Optimization Workflow (such as a pushback model) can also be input to these core charting tools.
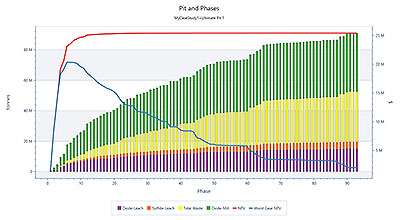
An example of a legacy optimization workflow chart
An example of a modern optimization workflow chart
An example of core system charts (scatter plots and line graphs are also available)
Legacy charts describe any loaded data column and can report against multiple columns using key field selection for weighting.
-
Charts showing strategic planning results from the Optimization Workflow can be created and edited using controls on the Optimization ribbon. These charts are created by defining a Chart Type and Chart Variables. Once a chart is created, you can edit it using the Chart Options screen.
-
Charts related to other data (in fact, any loaded data) can be prepared using tools found on the Reports ribbon (these can also be added to plots).
Related topics and activities: