
Summary Results
Your workspace lets you work with several planning documents at the same time.
Tabbed windows at the bottom of the Results display area give access to specific report tables, charts and summaries. At the top, you'll see a tab showing the name of the current project and either Summaries, Reports or Charts in brackets (more than one of these tabs can be displayed at the same time, letting you flip between result displays).
You will encounter the following tabular sheets often during strategic planning:
-
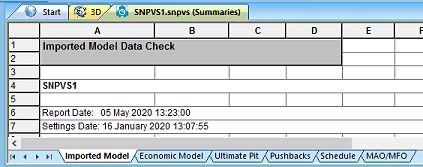
Summaries in spreadsheet format – Click a tab at the bottom of the window to see a particular view of the given type, for example; Imported Model. These views generally relate to the active Case Study (all summaries, most reports) but some do not; the latter have a Case Study ID (a number) appended to the tab label.
-
Reports in spreadsheet format – Similar to the Summaries view, each Report display area will contain one or more tabs at the bottom indicating the available reports.
Note: Custom reports are generated using the New Report function on the Optimization ribbon.
Related topics and activities: