|
|
Scatter Plots - Chart Properties Editing individual scatter plot chart properties |
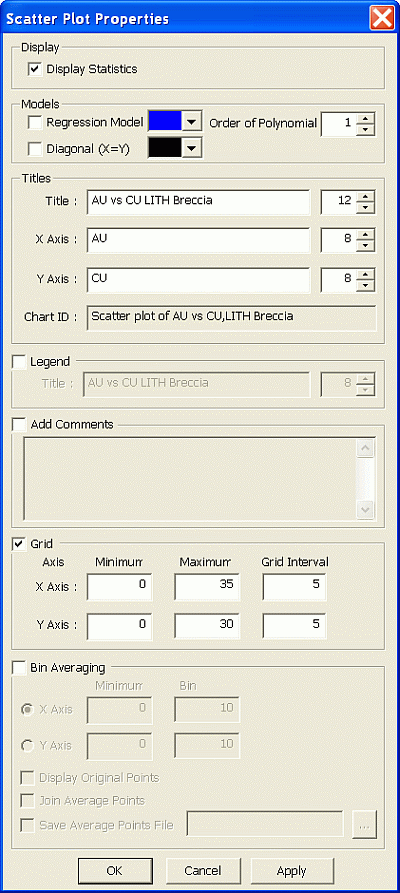
Scatter Plot Properties
To access this dialog:
-
In the Histogram dialog, Charts tab, select a chart item from the list,
-
Click Edit Chart Properties
 .
.
The chart Properties dialog is used to define the selected chart's Display, Models, Titles, Legend, Comments, Grid and Bin Averaging parameters.

Field Details:
Display:
-
Display Statistics: tick this box to display a summary statistics box on the chart, containing those statistics selected in the Statistics tab.
Models: this group contains the controls for the regression analysis lines:
-
Polynomial Regression: select this option to fit and draw a polynomial regression line.
-
Color Palette drop-down: select the required color for the polynomial line, if the Polynomial Regression option is selected.
-
Order of Polynomial: define the order of the polynomial function (default '1').
-
Diagonal: select this option to draw a Y=X line.
-
Color Palette drop-down: select the required color for the diagonal line, if the Diagonal option is selected.
|
|
The regression analysis coefficients and statistics are displayed in the Charts tab, Regression Analysis pane. These values are updated when either the Polynomial Regression or the Order of Polynomial parameter is modified and Apply is clicked. |
Titles: this group contains the title and axes label controls:
-
Title: accept the default or type in a custom description; select a font size from the drop-down.
-
X Axis: accept the default or type in a custom description; select a font size from the drop-down.
-
Y Axis: accept the default or type in a custom description; select a font size from the drop-down.
-
Chart ID: this read-only field represents the automatically-generated index description for the chart.
Legend: tick this box to display a legend box:
-
Title: accept the default or type in a custom description; select a font size from the drop-down.
Comments: tick this box to display comments in a text box:
-
Comments: type in comments; use <Enter> to define multiple lines.
Grid: tick this box to define custom grid parameters:
-
Minimum: X and Y axes minimum values
-
Maximum: X and Y axes maximum values
-
Grid interval: X and Y exes grid interval
|
|
The scatter plot 'grid' is determined automatically from the selected data columns and ensures that all data values for the chart in question are displayed within the preview area. |
Bin Averaging: tick this box to display average value data points, using the defined bin settings:
-
X Axis: select this option to use X axis bin averaging; define X axis Minimum and Bin width values

Original points falling below the defined Minimum will not be used to generate average points.
-
Y Axis: select this option to use Y axis bin averaging; define Y axis Minimum and Bin width values

Original points falling below the defined Minimum will not be used to generate average points.
-
Display Original Points: tick to additionally display the original data points
-
Join Average Points: tick to sequentially connect, in either X or Y, depending on the above selection, the average points with line segments
-
Save Average Points File: tick to save the average points to file; this option enables the filename box and browse button
-
 : define a points file. Opens the Project Browser dialog.
|
|
Average points will not be generated and displayed for those bins that do not contain original data points. |
| |
Related Topics |
|
|
Scatter Plot Charts |


