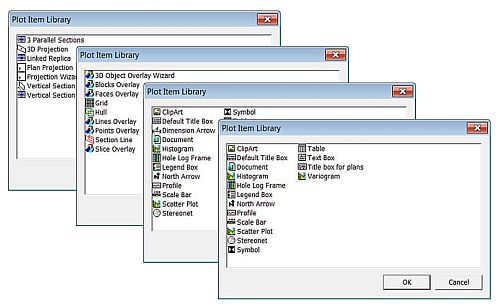
Plot Item Library
To access the Plot Item Library:
-
In the Sheets or Project Data control bar, right-click on Plots, select New Plot Sheet >> Custom.
-
In the Sheets or Project Data control bar, Plots folder, right-click on a sheet, projection or overlay, select Insert.
-
In the Plotsor Logs window, right-click on a sheet, select Insert (Page Layout Mode).
-
In the Plots window, right-click on a sheet, select Insert >> Locatable Plot Item (Normal Mode).
Note: You can also add specific plot items to your sheet using the Manage ribbon's Plot Items command group.
The Plot Item Library (PIL) provides tools to let you assemble a plot. The contents of the library will depend on the currently selected plot data.
For example, if the outer boundary of a plot sheet is selected, and the PIL is displayed, everything that can be added to a plot sheet is available. Including plot projections, sections and plot items such as north arrow, title box and so on. If a project is selected, the contents relate to projection items only (and the list is a bit shorter).
Plot Item Library examples
As such, the Plots window supports the concept of 'child' and 'parent' objects; some plot items are reliant on parent objects - such as a North Arrow, for example; a North Arrow must be associated with a projection in order to 'know' where to point. In this situation, plot items are added by inserting them at the correct layer of the Plots window hierarchy. See The View Hierarchy
When inserting plot items using the Sheets control bar's right click menu it is useful to remember that any plot items that relate to a particular projection (for example, a title bar that will list the description of a projection) should not be added at the Sheets level or above, instead, they should be added by right-clicking the relevant Projection folder and selecting Insert.
Plot Item Ribbons
Highlighting a plot item anywhere on a plot displays a dedicated ribbon containing various options for resizing, formatting and managing the contents of the target. All commonly-used properties can be accessed here and is generally the most convenient option for configuring plot items.
The options that appear depend on what you select. For example, selecting a Title Box plot item displays a ribbon to let you manage the arrangement of cells within it, whilst selecting a North Arrow item displays a different set of controls to determine the arrow's appearance:
The Title Box ribbon
The North Arrow ribbon
Note: To return to more general plot management functions, activate the Manage ribbon. Plot item ribbons only display for as long as the plot item is selected.
Note: Deselect a plot item by holding <CTRL> and left clicking it.
Related topics and activities


