Text Box Plot Items
To add a text box plot item to a plot sheet:
-
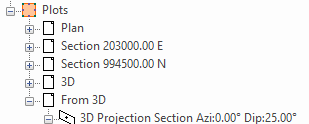
Plots window (and select a projection) >> Manage ribbon >> Plot Item and select Text Box from the Plot Item Library.
-
Plots window (and select a projection) >> Manage ribbon >> Plot Item >> Text Box.
Add text to your plots using a text box. Text boxes can be added anywhere and have no associated data context. As such they are useful for adding free form text to your plot.
Like other plot items, text boxes can be repositioned, resized and formatted. Their contents are also configurable with respect to font, colour, font size and so on.
Note: This plot item can be drawn before or after other plot items, say to ensure it is shown on top of another one, using the Drawing Order tab. See Drawing Order.
Sharing Text Box Properties
Sometimes, for consistency, you want multiple plot items on the same sheet to share the same characteristics. This could be visual formatting, for example, so you can make more general changes to the appearance of your plot report without having to adjust multiple plot item properties.
To achieve this, use Share Properties. First, decide on the items that will share properties, then choose which properties to share.
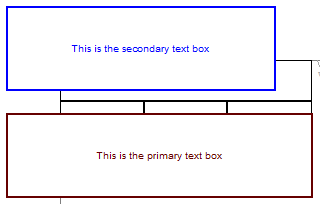
Consider the following example, where two text boxes exist on a plot sheet. They both (intentionally) have different colouring and text contents, but they would look better if they were the same width:

To make these text boxes (always) have the same width:
-
Display the Properties control bar.
-
Display the Plots window and the plot sheet containing the text boxes.
-
Define the extent of sharing permitted for the current project. This is done by setting the Share property on the Overlays object of the projection:
-
Display the Sheets or Project Data control bar.
-
Expand the Plots >> [Plot Sheet Name] >> [Projection Name] folders, for example:

-
The projection group (regardless of whether it is a 2D or 3D projection type) will contain an Overlays entry.
-
Right-click the Overlays item and select Overlays Properties.
The Overlays screen displays.
-
Ensure the Share value is Within Sheet.
Note: You can also share text box information with other plot sheets using the Within Document option.
-
-
Select the primary text box.
The properties of the plot item display in the Properties control bar.
-
In the Properties control bar, expand the Sharing group.
-
Change Share Properties to Yes.
-
Add a unique value to Set ID. This ID is used to link text boxes on the sheet, so won't be unique for long.
-
Change the Width setting to Yes.
-
Ensure all other settings are set to No.
-
Click into the secondary text box.
-
In the Properties control bar, expand the Sharing group.
-
Change Share Properties to Yes.
-
Add a unique value to Set ID. This ID is used to link text boxes on the sheet, so won't be unique for long.
-
Change the Width setting to Yes.
Both text boxes are now the same width, and adjusting one will automatically adjust the other.
Create a Text Box
To insert a new text box into a plot sheet:
-
Activate the Manage ribbon and select Insert >> Plot Item >> Text Box.
Note: You don't need to select a projection or another plot component before adding a text box as there is no loaded data association.
An empty text box displays.
-
Double-click the empty text box.
The Text Box screen displays.
-
Enter text and define your text formatting, alignment and drawing order. See Text Box.
-
Click OK.
The text box updates to show the latest changes.
Edit a Text Box
To edit an existing text box on a plot sheet:
-
Display the plot sheet containing the text box.
-
Double-click the north arrow to display the Text Box screen.
-
Configure the text box using the same controls as for new text box.
Move or Resize a Plot Item
To move or resize an existing plot item:
-
Select the Manage ribbon and enable Page Layout Mode.
-
Click to select the plot item.
Resize boxes appear around the plot item.
-
Ensure the Lock toggle on the plot item's ribbon is not active. If it is, deactivate it. If the Lock toggle is active, the height and width (and rotation) cannot be changed.
-
To resize the plot item (and if supported, proportionally resize contents) drag one of the control points to a new position.
Tip: To retain the original aspect ratio of the plot item during resizing, hold down CTRL.
-
To move the plot item, position the mouse inside the plot item until the cursor changes to a four-way arrow. Then, left-click and drag the plot item to a new position on the sheet.
Note: If a plot item is parented to another item, it can still be repositioned outside the boundary of its parent. For example, a title box associated with a projection can be positioned anywhere on the plot sheet, even outside the projection.
Tip: When moving a plot item, it will attempt to 'snap' to nearby objects. Override this behaviour by holding down SHIFT.
Rotate a Plot Item
Plot items that display a green rotation symbol after selection can be rotated.
To rotate a plot item:
-
Select the Manage ribbon and enable Layout Mode.
-
Ensure the Lock toggle on the plot item's ribbon is not active. If it is, deactivate it. If the Lock toggle is active, the height and width (and rotation) cannot be changed.
-
Left click to select a plot item.
The resize and rotate controls display, for example:

-
Left click and drag the green rotate control.
-
Release the left mouse button to redraw the control at the new orientation.
Tip: Small plot item resize handles can blend into each other. Zoom in to see each resizer more clearly.
Related topics and activities

