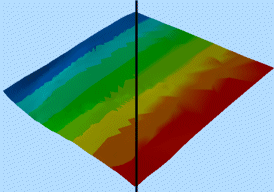
Wireframe Properties - General Dialog

Managing wireframe display properties in the 3D window

Wireframe Properties - General Dialog

To access this dialog use:

  • In the Sheets control bar, active 3D window | Wireframes folder, right-click a wireframe, select Properties

  • Double-click any wireframe object in any 3D window

note.gif (1017 bytes)

The settings described here apply to the currently active 3D window and all linked external windows. Independent windows will be unaffected.


The General tab is used to manage the rendering and sequence animation options for a wireframe surface.

Field details:

Name: displays the current name of the selected data object overlay.

Source: shows the name of the loaded object from which the current 3D overlay was derived.

Texture: define how (or if) texture draping will occur on the target wireframe. You can either display a non-textured wireframe or apply a texture image. If your loaded data object supports per-triangle texture position information (such as with loaded .obj, .ply and similar data object types), this information will be used by default.

The following options are supported for texture mapping:

  • None: disable all texture mapping for the target wireframe. If the wireframe is currently textured (either with a nominated image file or using embedded triangle-based texture information), selecting this option will disable texturing and display the wireframe in whichever Color setting is set.

  • Texture image: browse for and specify an image that will be used to provide texturing. If the selected image contains georeferencing information (for example, as part of a .png/.pngx file pair or an .ecw format file), you will be asked if you wish to use it. Texture can also be manually positioned on a loaded wireframe object using Texture Drape Settings.

  • From object: if your loaded data object contains per-triangle texture position information, you can choose to use it with this option (this is the default option for certain wireframe data types, such as Wavefront .obj files and similar). If selected, the triangle-based information will be used to position your wireframe texture.

    If your loaded wireframe object does not contain embedded texture position information, the From object option is disabled.

For more information, see Draping Images.

Intersection Section: the Wireframe can be displayed as an intersection string by selecting a previously defined section from this drop-down list. This will result in the Wireframe being displayed as an intersection line in the selected section's plane.

note.gif (1017 bytes)
  • To enable this drop-down list, the Shading group's Intersection option needs to be selected (see below).

  • If there are no 3D sections in memory, this drop-down list will only contain a [<none>] option. In order to show an intersection, you must define at least one intersection plane first.


note.gif (1017 bytes)

You can superimpose an intersection view of a Wireframe onto a full (possibly transparent) Wireframe by loading the same Wireframe object in the 3D window twice. Then, set one Wireframe to be an intersection, and another to a transparent 'full' wireframed ( wireframed, flat, smooth, highlighted edges or points), e.g:


Shading: change the way the wireframe object is rendered, using one these options:

  • Points: display the current wireframe as vertex data only.

  • Wireframe: render the wireframe object as edges only. Selecting this option will enable a Lines tab, to allow the wireframe lines to be formatted independently of the surface.

  • Flat: render wireframes without smoothing, potentially making wireframe triangles more obvious. This setting can be useful if your wireframe features a sharp directional change of surface, such as the edge of a modelled vein, for example. Selecting this option enables the Unlit option below.

  • Smooth: render wireframes with smoothing. This will make the wireframe appear smoother, without adjusting any edge or point positions of the underlying data. Selecting this option enables the Unlit option below.

  • Highlighted Edges: render Wireframes as flat Wireframes (no smoothing) but with highlighted edges. Selecting this option will enable a Lines tab, to allow the wireframe lines to be formatted independently of the surface.

  • Intersection: use in conjunction with the Intersection Section drop-down list (see below), select this option to visualize your Wireframe as an intersection line, where the Wireframe crosses a previously defined section or the currently active section (the default setting for this option). Selecting this option will enable a Lines tab, to allow the wireframe lines to be formatted independently of the surface.

    More about sections, including the active section concept...

  • 3-way intersection (Variogram window only): this option is selected by default for all generated isosurfaces that support a variogram map display (using the Advanced Estimation - Investigate Anisotropy panel). Whilst selected, the selected wireframe surface will be shown as an intersection will all 3 displayed sections. This differs from the standard Intersection option (see above) which will only display an intersection with the currently active display section:

    3-way intersection:


    Intersection:


  • Unlit: available for Flat and Smooth shading options only, this check box, disabled by default, determines if the Wireframe in question 'reacts' to the virtual light sources in your VR scene. If disabled , light will be rendered according to the position and settings of all available light sources. If enabled, the Wireframes will be 'flat' rendered, and will be displayed with the base underlying color(s) or texture shown without any positional lighting effect:

Wireframe with "Unlit" Disabled

Wireframe with "Unlit" Enabled


Color: display legends can either be a standard fixed color, or you can choose to color your data according to a display legend:

  • Fixed: select this option to use the same color to render your chosen item. Note that this color will also be used to color data that cannot be matched to a legend interval when the Legend option is chosen (see below).

  • Legend: when this option has been selected, the initial drop-down list in this area can be used to select a predefined legend (system standard or user-created).

Column : When a legend has been selected, you will need to select a data column that contains the values to be matched to the legend for display purposes, using the Column drop-down list. Note that only fields relevant to the currently selected object are shown. As with all legend drop-down lists, once an item has been selected, you can elect to edit the chosen legend or preview it. You can also automatically create a default legend for any selected field:
 

Preview the currently selected legend intervals and display properties

Edit the currently selected legend using the Legend Manager.

Create a default legend for the selected data column.


RGB: if your data object contains attribute reflecting RGB colour information, select them here to colour your data using this in-object information. Only numeric fields will be available.

Any colour depth is supported; define the Maximum Value for the colour attributes. For example:

  • 4-bit colour depth is described a Maximum Value of 15 (0-15 = 16 per colour channel)

  • 8-bit colour depth is described using a Maximum Value of 255 (0-255 = 256 per colour channel)

  • 12-bit colour depth is described using a Maximum Value of 4095 (0-4095 = 4096 per colour channel)

  • 16-bit colour depth is described using  a Maximum Value of 65535 (0-65535 = 65536 per colour channel)

  • 24-bit colour depth is described using  a Maximum Value of 16,777,215 (0-16,777,215 = 16,777,216 per colour channel)

Intersection Section: only available if the Intersection Shading option has been selected (see above). Select a section from the drop down list to display the object as an intersect. Intersections will be displayed using a fixed color.

You can either choose a predefined section or choose the <Active Section> option. Selecting this will update the formatting of the wireframe object so the active section is used to generate an intersection. Changing the active section updates the view. This can be useful, for example, where a section definition table has been loaded for sectional interpretation of drillhole data in the context of an implicitly-modelled volume.


Sequence Column:

Column : select the field from which sequence data will be taken when a simulation is played.

Sequence Options: parameters to be used when playing a sequencing animation. Once these properties have been defined, you can access the object's Sequence Controls context menu item (Sheets control bar) to display an animation console.

Forwards: sequence the animation according to the increasing value of the selected attribute.

Single Frame: replace instead of adding to displayed view frames.

Reverse: play the sequencing animation for the selected Wireframe starting with the highest record value and working backwards. In most circumstances, this will result in the view of a Wireframe being eroded throughout the animation.

Anim. Rate: select a play rate, units per simulated second. These values effect the appearance of the Wireframe when the simulation Play button is pressed. A positive value in the rate setting adds new faces to the empty mesh as time progresses. A negative value in the rate setting removes faces from the completed mesh.

Anim Step: used in conjunction with the above field, the Step facility allows you to group points of data so the animation is built up in larger 'blocks' than before. For example, if the animation Rate were constant between two simulations, setting an animation Step to zero in simulation 1 would cause a build up of data on a row-by-row basis. If a step of 10 were implemented, the model would be build up 10 blocks at a time, with each animation phase remaining for 10 times longer.

Loop: make the animation repeat.

Annotate: select a field from the object that will be shown as on-screen annotation during sequence playback. Select the Show Annotation check box to annotate the wireframe with sequence column data. You can control the formatting of the on-screen annotation using the Configure button to display the Sequence Annotation Overlay dialog. Select Configure to define the annotation's font, position and display text parameters, using the Sequence Annotation Overlay dialog.

In the example below, an annotation attribute has been defined for a block model (IJK) and a wireframe (ZONE). Each object is supported by its own Sequence Control bar below. The annotation is displayed for both objects (although configured differently for each). When the sequence slider of either object is adjusted, the corresponding annotation will be updated automatically.


This can be useful for interrogating data with respect to particular attribute values, or combinations of values. For example, you could render a block model using two separate overlays (by copying one), then sequence model 1 based on a grade value and model 2 on a density value.

Face Direction: this section deals with how each 'face' of Wireframe data is handled, and contains the following options:

Verify: selecting this option will attempt to produce consistent face normals from the input wireframe when generating the visualisation. Leaving this option unchecked will honor the wireframe's original normal directions. Choosing this option will result in slower preprocessing of the object on loading the visualisation.

note.gif (1017 bytes)

To avoid duplicate verification stages in the future, another option would be to Verify your wireframe  using the context menu Verify option in the Project Files control bar, and save the resulting object. The check box listed above could then be left clear.


Double side
: render both sides of the Wireframe. Double Side, actually generates 2 versions of the Wireframe: the normal one, and one with the normals flipped. This means that you can see it from both sides (but does create twice as much geometry, slowing things down a little). Obviously Flip Normals makes no sense with Double Side, which is why it is disabled in this case.

Flip Normals: turn an object inside out. A Wireframe normal is the vector which determines in which direction a face is pointing. In DirectX, faces can normally only be seen from one (the 'outside') as determined by the face normal. Flipping Normals leaves the geometry exactly where it is, but allows it to be seen from the other side instead (e.g. inside the tunnel, instead of outside).

Crease angle: specify the crease angle, which is the maximum angle between 2 faces at which smooth shading will be applied. Any angles sharper than this will have a well-defined edge between the faces, whereas any angles less than this will look like smooth curve (default '45').

Color with Block Model:

Block Model: choosing a block model object from the list will colour the wireframe based on the chosen block models attributes at that point in space, rather than the wireframe's attributes. If a block model is selected, the Color Column drop-down list will be populated with fields contained within the selected model, and not the wireframe. This allows the wireframe triangles to be colored according to the display properties of a block model position at the same point in space. When selecting a block model field, it is important to select a relevant legend (that is, one that relates to the selected block model field) in order to recolor the wireframe:


When using this option, you can either color wireframe triangles based on the first vertex position of each triangle, or according to position of the triangle centres (the 'centroids'). This is determined by the Use vertex color data check box (see below).

Opacity:

Opacity Degree: use this slider to adjust the transparency of the Wireframe. Moving the slider far to the left will effect 0% opacity (invisible) whereas sliding it to the right effects 100% opacity (zero transparency).

Options: the following additional options are available:

Use vertex color data: selecting this option will cause the display of color across each Wireframe face to be interpolated, in effect, causing a softening of the boundaries between differing color values. For example, the image below shows a Wireframe colored according to the X coordinate position. The left-hand section of the image shows a Wireframe displayed without vertex color data being used to interpolate, and the right shows a comparative view, with the face display interpolated (i.e. the Use vertex color data check box selected):


When coloring a wireframe Wireframe based on block model cell display values (for example, to see how a wireframe Wireframe interrelates with a geological model at the same location), this option will determine how colors are assigned to each wireframe triangle:

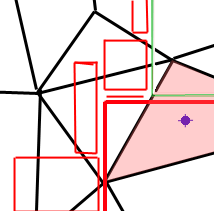
    • If inactive, the position of the centre of each wireframe triangle (the 'centroid') is important as the triangle will be colored according to the block model cell (or subcell) that it falls within, taking the color associated with the block model legend and column at that position. For example, in the image below, the centre of the wireframe triangle (shown as a blue dot) falls within a model cell that would be drawn in red:
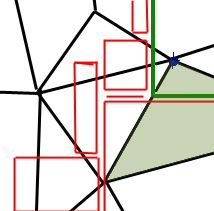
    • If active, the subcell the vertex of each wireframe is located within controls the vertex colour, as opposed to the triangle centroid. Continuing the example above, this time it is the vertex of the wireframe that dictates the color of the triangle; as the vertex (represented by the blue dot) falls within a green model cell:


Transparent texture: make a specified color transparent. This option appears on most other items (strings, points, objects etc) and is related to the use of color keying. In color keying, a single color (ie black (0,0,0)) is chosen to be transparent. When the user chooses the Transparent Texture option, anywhere the texture contains black will become completely transparent (regardless of the opacity setting in the Wireframe properties). Why you would use this varies from case to case. In objects, such as trees, the transparent texture is used to reduce geometry (we only use 2 faces for the trees, but the transparent texture makes it look more realistic). For Wireframes, especially with draped texture, it could be used to remove sections of geometry without actually regenerating geometry (e.g. to remove a part of existing topology, to show a proposed wireframe (separate object) underneath).

Tile texture: this option is only available when a named Texture is being draped over the wireframe. Selecting this option will result in the texture being repeated once its original borders are reached. Leaving this option clear will result in the border colour (normally grey) being applied outside of the original image border.

Tile size: to change the size. The tile size is used when applying a texture from a legend over the Wireframe and determines how big the texture image square will be in the virtual world. The texture image is the bitmap being used for the legend, and so the 'correct' size will depend on the image itself. A bigger number will make the original image look bigger on the Wireframe while a smaller number would do the opposite. Since the images are then replicated side by side (like wall tiles!) a small tile size can often look 'speckly'. Try applying a custom legend to your Wireframe, with the color value(s) for your Wireframe being associated with texture. Then play around with the Tile Size value to see the effect.

Shiny Surface: to change the Wireframe reflectiveness. A Shine % of '0' creates the default 'dull plastic' appearance. A Shininess of '100' will make the Wireframe look more 'metallic'.

note.gif (1017 bytes)

These Sequence Options control how the Wireframe is animated when either a single object animation is played from the Sequence Control dialog or a multiple object animation is started from the Simulation toolbar.


  openbook.gif (910 bytes)  Related Topics


Sequencing
Wireframe Properties Dialog - Labels TabInfo Mode List dialog
Associated Files dialog

About Sections