
Specify Variable Offsets for a Memo Report
Set up laser sights for a non-linear excavation plan using variable point offsets. A table of offsets is generated for each linkage point.
Typically laser positioning and referencing of this type is performed where excavation is non-linear, such as a curving decline or ramp, for example.
Activity Steps:
- Open the Memo Reports pane.
- To define the scope and general properties of your report:
- Select the Current Decline, Current Area and Current Level for the report.
Note: these options are created in Database Settings.
- Enter the following fields.
Next memo. Displays the title of the next memo report to be created. Use Format to either select a previously defined prefix or enter your own prefix as required.
Note: manage the number of digits in your memo title suffix by entering zeroes after another Format value. For example, if the format "Memo0000" is specified, memos will be titled using a similar increasing numeric suffix, e.g., "Memo0001", "Memo0002" and so on.
- Description
- Surveyor. Surveyors are defined in Database Settings.
- Report date
- Select the Current Decline, Current Area and Current Level for the report.
- To select 3D data for your report:
- Pick a Surveyed String representing relevant survey data. This string contains drive and development wall strings.
- Pick a Development Design String representing the planned development design for the corresponding reporting period.
Note: 3D survey data is added to your system using the Add to Database task.
- To view your 3D data before reporting:
 Load survey or design string data into the primary 3D window by clicking Load the Data into the Project.
 Preview 3D data using InTouch GO by clicking View the data in the previewer.
- Select the Variable Offsets tab.
- Ensure your Surveyed String and Development Design String are displayed clearly, including laser indicator strings.
Tip: Filter, pan and zoom the view to ensure the laser location and final laser destination on a surveyed string is clearly visible.
- To configure your laser position and direction:
- Select Pick Laser Line and pick the start of a laser reference string in the 3D view. It is important to select the start of the line, i.e. the actual laser device position.
The laser string is highlighted and a "LASER" indicator appears.Note: The first time a laser line is picked in a project session can take a short while to complete. Subsequent picking is quicker.
- Select Extend Laser Line and pick a design string vertex to which to project the laser line, for example:
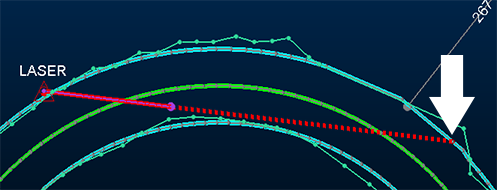
The laser string will be extended along its current azimuth to the target design string position.
- Select Pick Laser Line and pick the start of a laser reference string in the 3D view. It is important to select the start of the line, i.e. the actual laser device position.
- To calculate centerline offsets and linkage points:
- Click Pick Design Centerline and choose the design string that represents the direction of development. The centerline is highlighted in green.
- Click Pick Design Walls and select the design string walls. Design string data can be picked in any order. These strings are highlighted in cyan.
- The Design Information group fields are automatically populated with design string attribute values, which include:
Drive name
Drive width
Drive height
Drive gradient
Drive profile
Ground support standard
You can edit these field values for reporting purposes.
- Edit Design Information group fields if required. Values will be shown in the final report but the underlying data object will not be updated.
- To define how laser offset positions will be measured:
- Select Perpendicular to design to configure laser offset intervals perpendicular to the design string, e.g.:
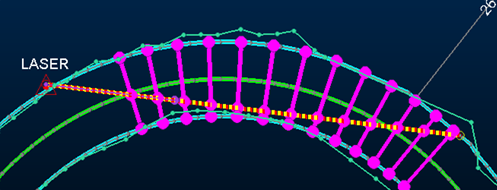
- select Perpendicular to laser to configure offset intervals perpendicularly to the laser sight line. For example:
- Select Perpendicular to design to configure laser offset intervals perpendicular to the design string, e.g.:
- By default, offset data includes the distance from the design centerline leftwards and rightwards. You can include a height offset if required;
- If Include height offsets is selected, your output report includes elevation offset from the design centerline in addition to left and right offsets.
- If Include height offsets is unselected, only left and right offset values will be reported.
- Specify the laser Height in meters.
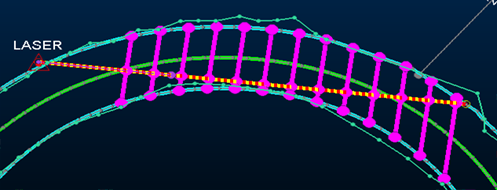
- Click Create Offsets. Linkage point indicator strings display in pink.
- To modify linkage point indicators:
- Use Insert to pick a position to add a new linkage point between the first linkage point and the end of the extended laser line.
- Use Move to select and drag an existing linkage point anywhere between the first linkage point and the end of the laser line.
- Use Extend to shorten or lengthen any linkage point indicator (say, to compensate for a known design string error).
- Use Delete to remove a linkage point indicator. Deleted indicators will not be used to calculate offsets for your memo report.
- If required, add additional Comments. These will appear on the generated report. Comments are specific to a report.
- Choose the scale of your report:
- If Use a fixed plot scale is selected, enter a ratio value to fix the output report scale, regardless of the current view position and scale.
- If Use a fixed plot scale is unselected, the output report resembles the current 3D window scale and view direction.
- Click Create Report to generate all report media (as defined in Database Settings).
A new entry is added to the Results list and Memo is suffixed automatically to form a unique ID. - To view the memo report and associated 3D data:
- Expand Results to select the generation time of the report data. All reports run on the Report date are listed.
- Load your memo report results into the 3D window using Load the Data into the Project.
- Display selected report media using View the data in the previewer.
Note: select report media output options in Database Settings. This can include a PDF report, a Plot sheet and a Windows file explorer view.
- Review your output data.
- To save a hard copy or PDF of a Memo Report plot sheet:
- Display your Memo Report plot sheet.
- Display the Project Menu.
- Select Print.
- Define your local printer properties. If outputting to PDF, pick a PDF printer driver.
- Confirm your settings to start printing, or specify a file and location for an output PDF report.
- Save your project.