Viewing Plots
Plots are displayed as one or more plot "sheets" in the Plots window. Sheets appear as tabs along the bottom of the viewing area.
Each sheet can contain one or more plot items, including views of 3D data, either from a particular view direction, or as a section of data. See Sections and Projections.
Plot sheets are stored within your Studio project, and can be exported as templates for consistency when creating reports.
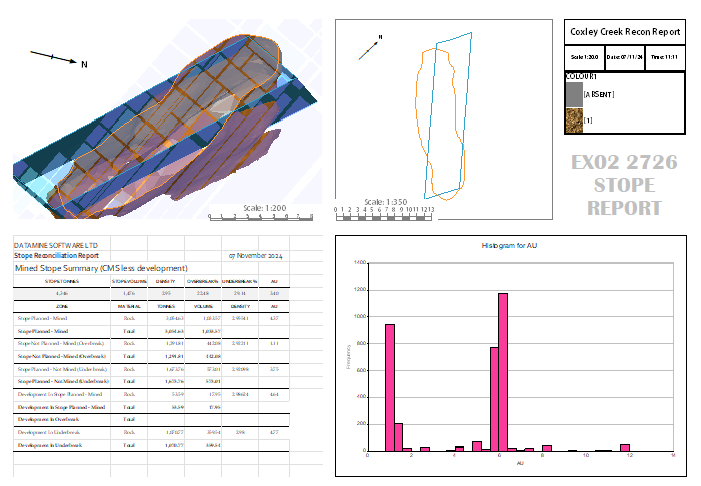
A plot sheet showing two projections (top left and middle) with different view settings
If displaying a projection, the "view" is important. This is the direction from which data is seen. Throughout these help files, this is referred to as the "view direction". Each projection can have its own view direction, making it possible to view the same data from multiple angles in the same report. Projections can also have independent visual formatting too so a wireframe could be displayed as a shaded volume in one projection, and a clipped section in another, for example. The image above shows this in action.
The view direction of a projection is entirely configurable, and if you are using a section to either indicate a 3D plane position in relation to your data, or using the section to orient the view, or you are using the section to slice or clip data, the projection's section is also configurable.
There are several ways to edit the view of a plot sheet projection (regardless of its type). Here are some of them, which might save you time when configuring your data views:
-
Use the Properties control bar—This method involves selecting a projection and displaying the Properties bar. The View Direction and View Centre can be set by entering values for Azimuth, Dip, X, Y, Z and so on. See Projection Properties.
-
Double-clicking a projection to display the same projection properties as above, but in a popup screen.
-
Interactively, by holding down SHIFT and left clicking a 3D projection and moving the mouse to rotate the view.
-
Right-clicking a projection whilst Page Layout Mode is active and selecting Projection >> Direction and picking one of the options presented.
Also, see View Direction.
The most important view settings for a projection are:
-
The world coordinates at the centre of the view. This determines the data you are 'looking at'.
-
The orientation of the world in relation to the camera, that is, the view direction's azimuth and dip.
-
The scale of the date being displayed (the 'zoom factor').
To ensure your report is meaningful, it is important to display at a sensible (and indicated) scale, according to known measurement units. See Plot Drawing Scales and Units.
You can also scale the view, using on of several zooming options. These are also available via right-click menus.


