
Join Activity Data
To access this screen:
-
Using the Utilities panel, expand the Join Activity Values to Points, Solids and Outlines section.
Use this facility to associate existing geospatial attributes with generated activity points, volumes and outlines. You can do this in a tabular way using the Report panel, but this method can help you visualize your attributes in their relation to processed schedule data.
You can apply non-system attribute data to your generated points and solids. This does not include the following attributes, or any others excluded by other settings elsewhere in the system:
- _X_Coord
- _Y_Coord
- _Z_Coord
- DES_TYPE
- COLOUR
- LSTYLE
- SYMBOL
- TAG
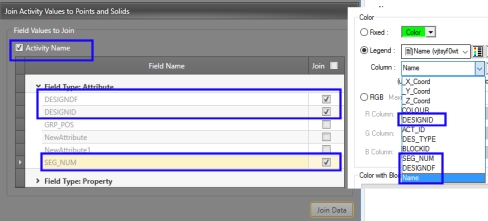
A special case is Activity Name, shown at the top of the panel. If enabled, the activity name (according to the current convention) is applied to the 3D data records for points, solids and outlines. You can then filter, for example, to show only data associated with a particular activity or activities.
In addition to the activity name, you can also join any project attribute (that isn't excluded) by selecting it in the list below, You can choose from attributes (e.g. DESIGNDF) or properties (e.g. Insitu_Mass). Any combination of values is permitted.
You could also use this facility, as another example, to show high/low grade areas in relation to your output schedule data. Whatever you decide to visualize, you can also output it in plot format for hard copy reporting.
To define how activity values are joined to points, boundaries and solids:
- Initially, nothing is selected, meaning there is no data to 'join'. The Join Data button activates once at least one attribute or property has been selected. You can select them all if you want, using the check box at the top of the list.
-
When you select Join Data the solids, points and outlines for each design type (in your project) are loaded and the selected attribute and property fields and values are added (afterwards, you can review those values in Data Object Manager if you wish, or apply labels, apply legends, or filter the data etc.).
The image below shows the available attribute values for FXS volumes after joining selected attributes:
If you change the selection of attributes while the data is already loaded and select Join Data, any fields that have been de-selected are removed and any additional fields selected are added.
Related topics and activities