|
|
Studio UG Tutorial - Connect to EPS Export your schedule data to a linked EPS project |
Underground Planning Tutorial - Connect to EPS

Studio UG and Datamine's Enhanced Production Scheduler (EPS) are partner products; you can connect data in one product with the other so that they function as a single, greatly-extended application.
This section requires version 3.0.147.0 of EPS to be installed on the local system (the same system running Studio UG). If you don't have access to a suitable version of EPS, you can skip this section if you wish, but you should consider discussing EPS with your local Datamine representative as it is an invaluable supporting tool for Studio UG as it provides a wide range of tools to manipulate your generated schedule and account for all of your operational requirements.
As schedule data that is modified in EPS can be synchronized with Studio UG, this combination of products gives you the power to generate production-ready mid- to long-term underground schedules.
In this section, you will transfer your current schedule information to EPS using a template file. This template is provided as part of your tutorial data set and is used to automatically set up various schedule properties in your EPS project.
Once transferred, you are 'connected' to EPS. Exercises here will demonstrate how to make changes to your schedule in Studio UG, then update the EPS schedule, then make other changes in EPS and bring them back into your Studio UG project.
Finally, you'll review an animation of your fine-tuned schedule in the 3D window before moving on to the next section.
Prerequisites
-
You have completed the previous section (Create Dependencies).
-
Enhanced Production Scheduler v3.0.147.0 or later is installed on the local system (and licensed). It should not be running.
Exercise 1: View Template Report and Correct Mismatches
In this exercise, you will generate a new EPS project file on disk, using your current schedule data (incorporating your previously-defined dependencies).
- Using the Planning ribbon, select EPS.
- In the Transfer
Data to EPS panel, a default schedule file name "UG_Tutorial.ews"
is specified. This is fine for your tutorial.
Ensure the Create new schedule option is selected. - Select the Use Template check box.
- Use the template browse button to locate the file "Benching_EPSTemplate.ewst", located in your project folder (it was downloaded in the first section).
- Click Transfer
to display the Template Report
panel.
This can take a few seconds to display as an external EPS service is run (you'll see an EPS icon flash up in the Windows task bar for a second then disappear again), then the template is reviewed and data is posted back to the Studio UG panel.
This panel is used to compare your schedule data with the information currently stored in the selected EPS template file (.ewst). It is useful as it highlights areas where, say, a match cannot be found between a Studio UG schedule attribute and a corresponding entry in the EPS template.
In your case, there's a problem with the DESIGNDF attribute: in Studio UG it is defined as a Code Field (and can't be changed but the specified EPS template is expected an text field: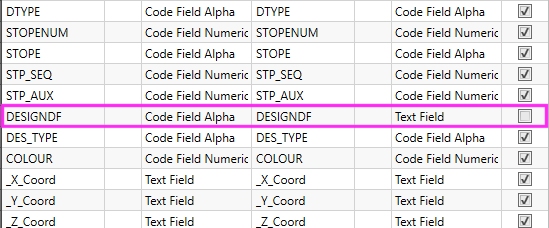
- To remedy this, you'll need to use EPS to change the template so that references DESIGNDF as a code field:
- Close the Template Report window.
- Leave Studio UG running but access your Windows project folder.
- Double-click the EPS template file Benching_EPSTemplate.ewst to launch EPS.
- In EPS, select the leftmost tab button:

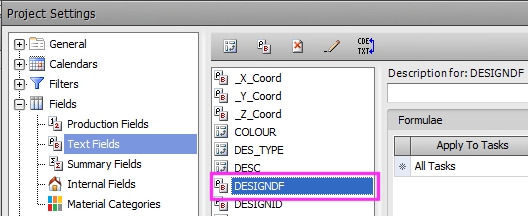
- Select Project Settings | Text Fields to display the Project Settings dialog. The Text Fields tab is shown by default.
- On the right, you'll see a list of all
Text Fields contained in the tutorial EPS template. DESIGNDF
is among them:
- Select the Convert Field Type button:
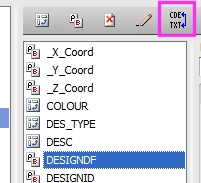
- In the EPS prompt that appears, click Yes.
- Click Apply in the Project Settings dialog.
- Click Close in the Project Settings dialog.
- Click File | Save and, in the following dialog, click Yes.
- CloseEPS.
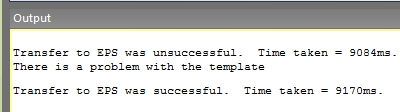
- Back in the Studio UG Transfer
Data to EPS panel, click Transfer
and this time, no Template Report
panel is displayed as the transfer completed without any issues.
This is reported in the Output
control bar (you'll also see a message from the previous attempt,
indicating the transfer wasn't successful) e.g.:
Exercise 2: Load Exported Schedule into EPS
Now that you've successfully transferred data to EPS, you can launch it and use Studio UG and EPS as a single application.
- In the Transfer Data to EPS panel, Animate a schedule group, click Load Schedule.
- EPS
is launched (it takes a few seconds to get started). If required,
use the Windows Task Bar to display it (it may be hidden behind
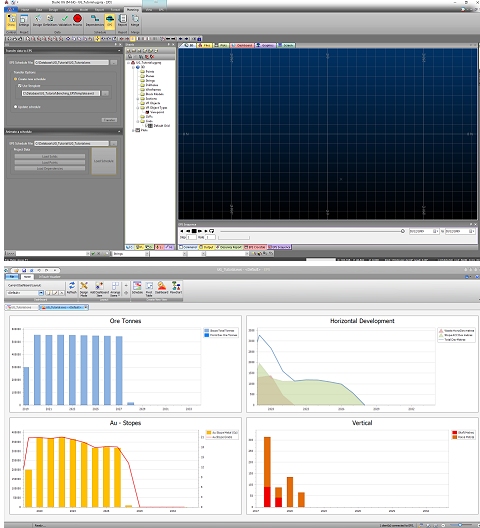
Studio UG, for example). Position EPS
and Studio UG alongside
each other. Ideally, this would be spread over two monitors, e.g.:
- In EPS,
select the Gannt chart view by selecting the leftmost display
selector:
- This displays the EPS
Gannt chart view of your schedule data.
This tutorial doesn't go into much detail about EPS functionality (there's a separate EPS Help resource for that) but as a brief summary: the Gannt chart view dedicates the majority of screen space (by default) to listing activities on the left and the corresponding schedule bars on the right. Each row in the table represents a distance activity, generated by Studio UG during processing and dependency setting.
Move the scroll bar in the right panel (showing data columns) to the far left to see a collection of short schedule bars: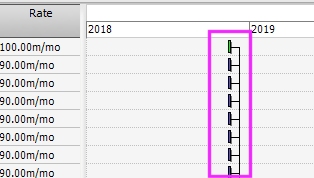
- Use the vertical Gannt chart scroll bar to
quickly review the position of schedule bars as you progress down
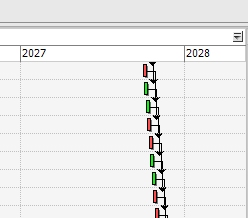
the project (and forward in time). The final batch of activities
can be seen in the latter column. These represent the final activities
for the current schedule (they actually represent stoping and
derived backfilling activities in the western region of the mine.
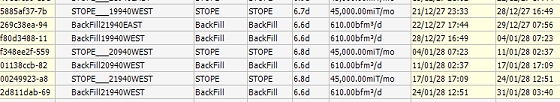
- Each activity is described (by default) using
a collection of parameters to indicate the activity ID (unique),
the Name (as provided by your Studio UG Naming Convention), the
DESIGN DF (the design definition for the structure that relates
to the activity), its Description and mining rate and duration,
the activity Start and Finish date/time and a host of other properties,
including the activity predecessor (if one exists) and other exported
properties such as in situ
volume, mined mass, mined volume etc:
In the next exercise, you will review an animation of the current schedule.
Exercise 3: Review Default Schedule Animation
EPS is now running and is
'connected' to your Studio UG data. This is where you can start to
treat Studio UG and EPS as a combined product.
In the following exercise, your schedule information (as currently
synchronized between Studio UG
and EPS) will be reviewed
using a 3D window animation.
- Your Studio
UG application will now include an EPS
Sequence control bar (at the bottom of the 3D
window):
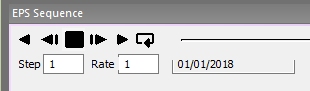
- On the right of the control bar, you can see the date range of the activities currently displayed in the 3D window.
- At the moment, no data is loaded, so the 3D window is empty. In Studio
UG, you can animate any combination of your solids, activity points
and/or dependency strings.
In the Transfer Data to EPS panel, click Load Solids. - It can take a while to load solids data. Once loaded, the 3D window is populated with volumes representing your fixed cross-sectional extrusions and wireframe data.
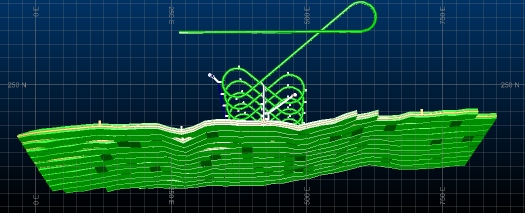
- Zoom
the view so you can see all of the 3D
window data:
- Click Load Schedule.
- Move the slider in the EPS
Sequence control bar to the left. Your initial activities
are displayed:
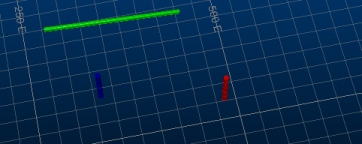
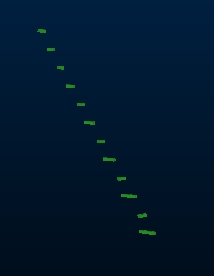
These volumes represent the initial decline ramp and two ventilation shafts (inbound and exhaust). - Click Play
in the EPS Sequence control
bar to start the animation - this represents how your schedule
volumes will be progressed through the life of mine:
- Click Stop to stop the animation at the current frame
Exercise 4: Connect EPS and Studio UG
In the following exercise, you'll witness the dynamic data link between Studio UG and EPS, and how updates to your schedule in EPS can be brought back into Studio UG. Specifically, you will change the rate of a single activity in EPS to extend the schedule, then see the impact on the Studio UG schedule date range.
- Make sure the EPS Sequence control bar slider is at the far right, and all solids are displayed:
- Using the Quick Filter control bar, display only the following data:
- Column: DESIGNDF
- Value: DECL_ACC
- Using the View ribbon, select View | Zoom East.
- You should be looking at a view similar to this:
- Using the EPS ribbon, enable the Select toggle to activate activity selection mode.
- Using the left mouse button, drag a selection rectangle around all of the displayed decline access structures.
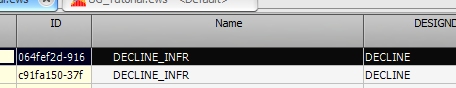
- Have a look at the EPS
Gannt Chart view - you'll see that all of the selected Studio
UG activities are also selected in EPS,
e.g.:
- Remove the Quick Filter
selection and Zoom Plan
to display all of your volume data as before. Make sure the EPS Sequence control bar slider
is on the far right:
- In EPS, expand the Task Filters group in the Sort, Filter, Group section.
- Select [DESC DECLINE]:
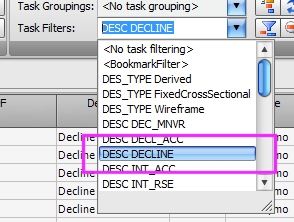
- The view of data in Studio
UG is filtered to match the filtered recordset in EPS:

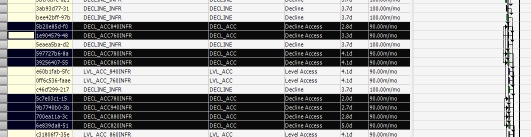
- Select the first segment of the decline in Studio
UG. As select mode is still active, this will highlight
the uppermost record in EPS:
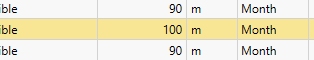
- The selected EPS activity
starts at midnight on 16/11/18 and finishes at 15:40 on 19/11/18
(a duration of 3.7 days). This is based on a 12m segment length
and default rate of 100 meters a month. This was set up when you
prepared your DECLINE
design definition in an earlier section:
In EPS, this is shown in the Rate column, e.g.: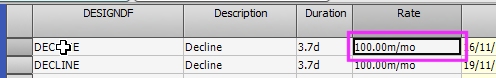
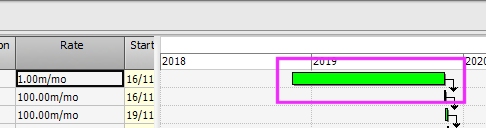
In EPS, edit the Rate for the initial DECLINE activity so that it is "1.00m/mo". - Decreasing the rate this severely causes the schedule bar to
increase in length on the right, effectively pushing the whole
schedule almost a year into the future:
- In EPS, click Clear Filter (Bookmarks group,
Home ribbon) to remove all filters.
The Studio UG display is also updated to display all volumes (make sure the EPS Sequence control bar slider is on the far right). - In Studio UG, click Load Schedule to synchronize your UG data with the information held in EPS.
- Make a note of the EPS Sequence control bar date range (on the right of the slider).
- Back in EPS, change the rate for the modified DECLINE activity back to "100m/mo".
- In Studio UG, click Load Schedule again.
- Make sure the EPS Sequence
control bar slider is on the far right and review the date range.
This time the schedule is a year shorter than before due to the
increase in rate for the decline activity (which equates to a
time time-saving of approximately 353 days).
This is a simple example of how you can export your schedule to EPS, then use EPS as a 'connected product' to fine-tune your schedule and re-synchronize it with your Studio UG project. Coupled with a 3D animation facility in Studio UG, this product partnership makes it really easy to assess the impact of scheduling decisions on the mid- to long-term plan.
If you would like more information on Studio UG, you can refer to your Help file or Datamine's support portal.
To arrange for more in-depth training and see how Studio UG can be applied to your organizations specific operational requirements, please contact your local Datamine representative.