
Selecting the Optimal Lag Size for Variogram Modelling
The lag or lag size is the distance between sample pairs that the variogram is calculated for. The lag size you select for you variogram models determines the number of points that are displayed in the variogram, so it is important to select the best possible lag size for your data.
Lag sizes that are too small produce noisy variograms, whereas lag sizes that are too large may produce variograms with very little data. The example below shows the same variogram model with three different lag sizes.
Tip: Check Pair counts and Bars in the Draw tab to see a histogram of the number of pairs overlain on the variogram model. See Configure Variogram Draw Properties.
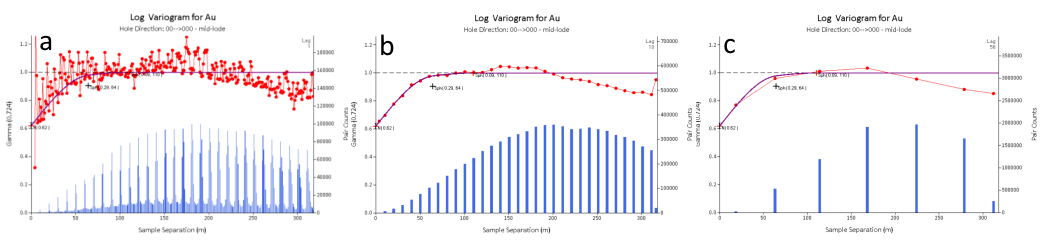
Variogram a – The lag size of 1 selected for this variogram is too small. The variogram is very noisy and a clear trend is difficult to distinguish.
Variogram b – The lag size of 10 selected for this variogram seems appropriate. This lag size produces a smooth variogram with sufficient data.
Variogram c – The lag size of 56 selected for this variogram is too large. The variogram is very smooth, but there are very few data points.
Tip: Look for any patterns in the number of pairs (the blue histogram) in your data to help inform your optimal lag size. Variogram a has peaks in the number of pairs every 10 m. This could mark the average distance between samples collected for your data, so the variogram can create more pairs at this distance, or multiples of this distance. Setting the lag size to 10 m, as in Variogram b, reduces a significant amount of the noise in the data because it removes points with very few pairs. This means that the remaining data is likely to be more accurate and so it creates a smooth variogram.
There is no single lag size that suits all datasets. The optimal lag size for your data depends on the distance between samples and the number of samples collected, as well as a host of other factors.