Variogram Modelling
Variogram modelling is the second of the two major stages of creating variograms in Supervisor. Variogram models can be made after Directional Continuity Analysis, but can also be made independently if directional analysis of your data is not required.
Variogram models describe the spatial relationship between samples in a dataset. Variogram modelling involves selecting a mathematical model to match to an experimental variogram curve. This is done by setting the nugget and up to three nested structures to fit the data to the models.
Variogram models are grouped under the Continuity Models component. There are four main variogram models.
- Hole direction - Referred to as the downhole variogram. Only uses sample pairs from the same drillhole so that they are highly related. This variogram model is used to set the nugget. See Set the Nugget on a Variogram Model.
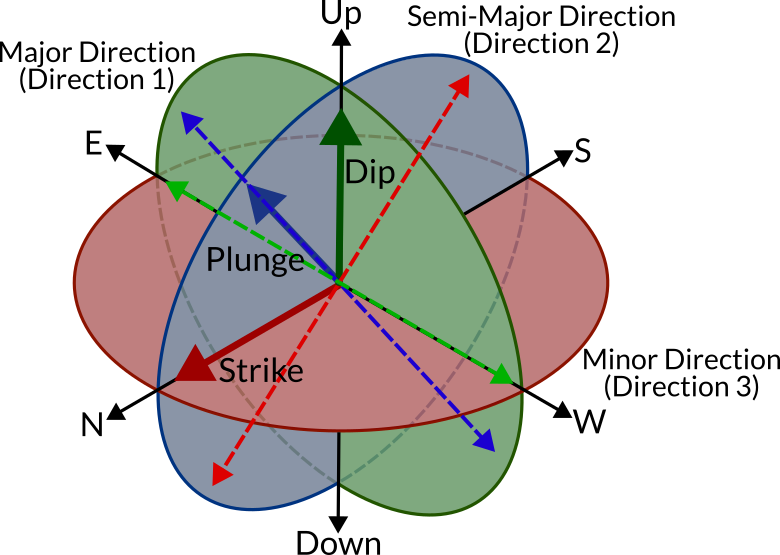
- Direction 1 – Plunge (the direction of maximum continuity on the dip plane).
- Direction 2 – Minimum continuity on the dip plane.
- Direction 3 – Minimum continuity perpendicular to the dip plane.
The image below demonstrates the relationship between the directions modelled and the strike, dip and plunge of the mineralisation. The variogram model directions are represented by the blue arrows.