
Cell Size Optimisation
Determining the optimal cell size is essential to calculate how data points should be weighted when declustering your data. Supervisor's cell size optimiser function assists you in finding a cell size where the mean of the weighted samples are either at a minimum (for high grade preferential sampling) or a maximum (for low grade preferential sampling). This function allows you to vary the three directions (X, Y and Z) independently.
The results for all cell size combinations can be exported to an external file, which can be used for post-processing in external software. The results can also be viewed (and exported) in the Results window through the tab at the bottom of the main canvas.
To determine the optimal cell size, enter a Min/Max and Step (increment) value for each of the X, Y and Z dimensions in the Cell sizes field group of the Decluster tab (see how to Decluster Data). If you are unsure about the values you should enter, assess your data in the 3D Viewer to see how much it varies in each direction.
Note: Supervisor cannot calculate thousands of steps, so only enter a range that is relevant to your data.
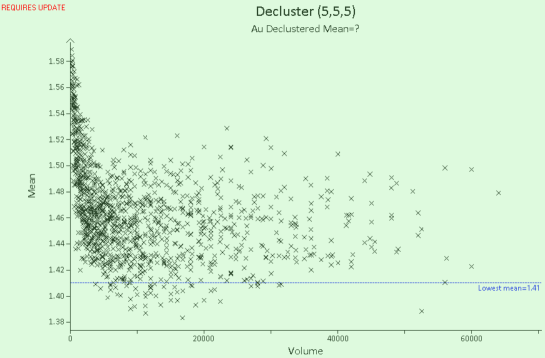
After entering the cell size data and generating the declustered mean plot, each combination of X, Y and Z cell sizes specified is calculated and the results are graphed according to the cell size mean (Y) versus cell volume (X), as shown in the plot below.
In this form, the plot is difficult to interpret. The X, Y, or Z directions can be set to a constant value, or two directions can be linked, to reduce the total number of combinations on the plot and make interpretation easier.
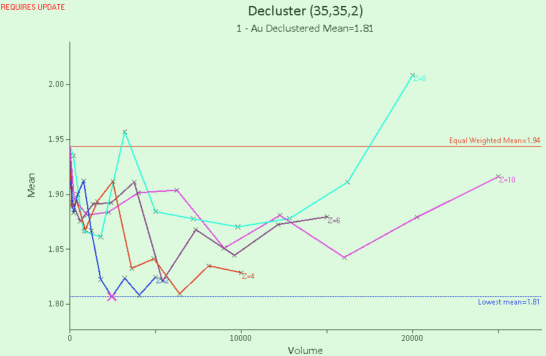
In the image below, the X and Y directions have been linked and lines have been drawn to connect cell sizes. Each individual line represents a constant Z value that intercepts combined X and Y values. The lines each represent a different view of the same data, so they all have a similar trend.
The data is compacted on the left side of this plot. This indicates that the Max values are too high in the X and Y directions and should be reduced. This data represents a high-grade deposit, so ideally we want to see the lines trend down and then start to inflect back up just before the right side of the graph. If the data were all to trend downwards, then the X and Y Max values need to be increased.
Note: For low-grade deposits, you would expect to see the opposite of the images below. That is, the data would trend upwards and then back down.


In the image below, the X and Y Max values have been reduced so that the plot ends after the lines start to trend upward again. The optimal point you select depends on what makes sense with your data, but ideally it should be close to the Lowest mean (blue dashed line).
In this example, there are three points that are close to the Lowest mean. Points that are closer to the left side of the plot affect fewer data points in the overall dataset than points that are closer to the right. Therefore, we could select the first point on the blue line (under the pink X) that intercepts the Lowest mean, as long as it makes sense with our data to do so.
Selecting the point automatically enters the coordinates into the Cell Size fields at the top of the Decluster property tab, where they can be use to apply a weighting to the rest of your data.
Anchor Point
Setting the anchor point allows you to control which data points fall closest to the centre of each cell. It is useful in situations where you have 2 or more drilling grids and you wish to favour one grid of data over the other(s) in the declustering process. To determine where to set the anchor point, choose the grid of points that you require to be treated preferentially and then select any point on that grid. The declustering grid is constructed and aligned to ensure that the centre of one declustering cell is automatically be located over the top of the specified anchor point.
The Auto check box automatically sets the grid anchor point; the point with the lowest easting, northing and elevation coordinates of the entire dataset is used. These coordinates can be manually entered after unchecking this check box.
By default, the component repeats the cell weighting 8 times by moving the whole grid one eighth of the cell size. This prevents weighting artefacts created by the way in which the grid happens to fall on the data points. This offset may be changed by entering another number in the Offsets field.