Viewing Gaussian Mean and Variance Results of Conditional Simulation
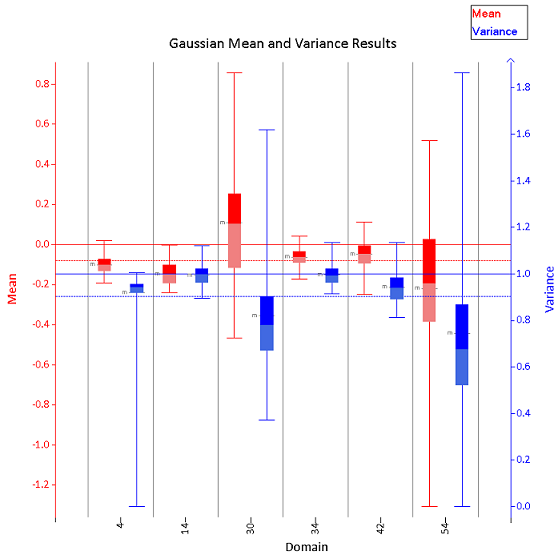
The main canvas displays the Gaussian Mean and Variance Results of the processed simulations after Simulation Generation is complete. Box plots are shown for the simulation mean (red) and variance (blue).
Note: These results are based on the gaussian space results before they are back-transformed for the final output. The complete Gaussian results are not retained during the simulation process.
As a general rule, the gaussian results should be close to a mean of 0 and a variance of 1. This means that the simulation has produced results that are similar to the original data. Significant deviation from these numbers may require further investigation to determine the cause. For example, a mean that is too low may be the result of data clustering, so declustering the data may produce a better result.
These target mean and variance values are marked with solid red and blue lines, respectively. The actual mean and variance values for your simulated data are marked with dashed red and blue lines, as shown in the image below.