
Configure Conditional Simulation
After successfully running a test simulation without error, you can run a full set of simulations.
Note: This is a small dataset, so running simulations is relatively fast. In larger datasets, this process takes much longer. Running a single test simulation allows you to ensure there are no significant errors before running an entire set of simulations, as well as gauging how long multiple simulations may take to run.
- Select the Conditional Simulation component in the Project Tree.
- Open the ConditionalSimulation tab in the Property Panel and change the following fields.
- Uncheck Test Mode.
- Change the Number Of Simulations to 20.
Note: this field is only available when Test Mode is deactivated.
- Ensure that the X and Y fields for the Block Size are both set to 2.
Note: A block model would often be used to define the coordinates and shape of the model, rather than specifying a region, as we are doing in this tutorial.
- Save your project.
Important: It is always a good idea to save your project before running a conditional simulation. If Supervisor becomes overloaded, it may crash.
- Click the Update
 button in the Main Toolbar at the top of the screen.
Note: It is best to use the single Update button, rather than Update Descendents or Update All buttons, for conditional simulations. Updating all components at once may overload Supervisor and cause it to crash.
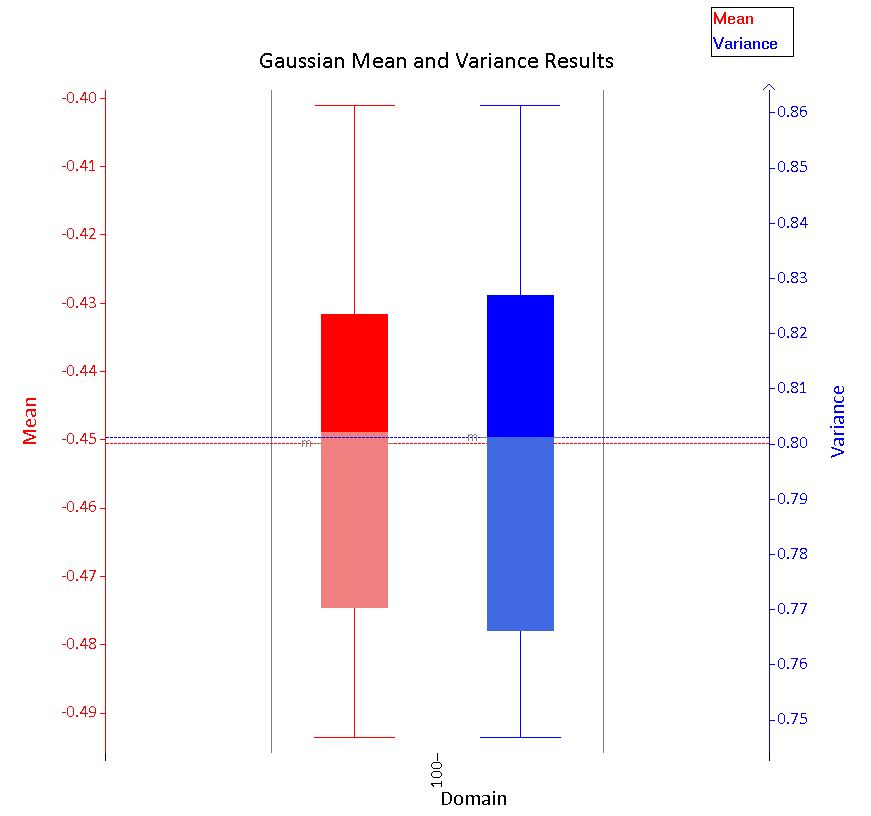
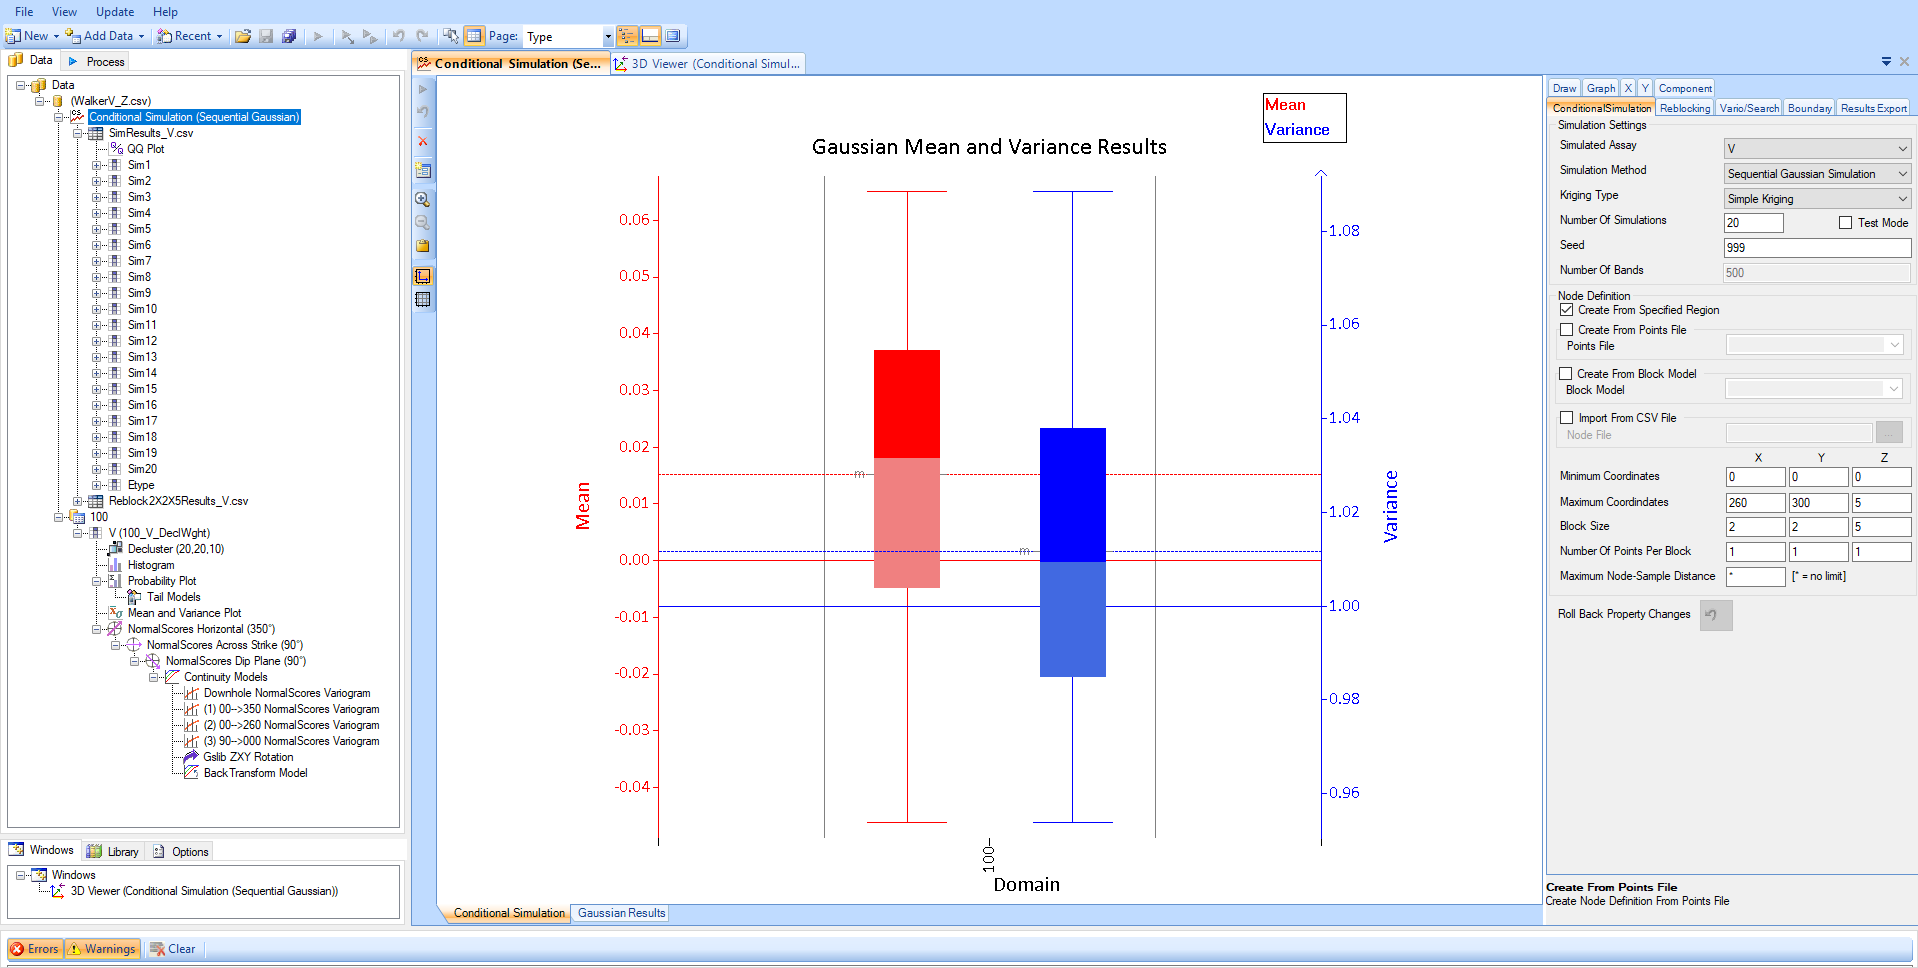
- Assess the Gaussian Mean and Variance Results plot. Supervisorautomatically applies a Gaussian transformation to the data when running a conditional simulation. This should result in the Gaussian mean being close to zero and the variance being approximately one. However, these simulations have an average Gaussian mean of -0.45 and a variance of 0.8; indicating that there may be some issues with the data.
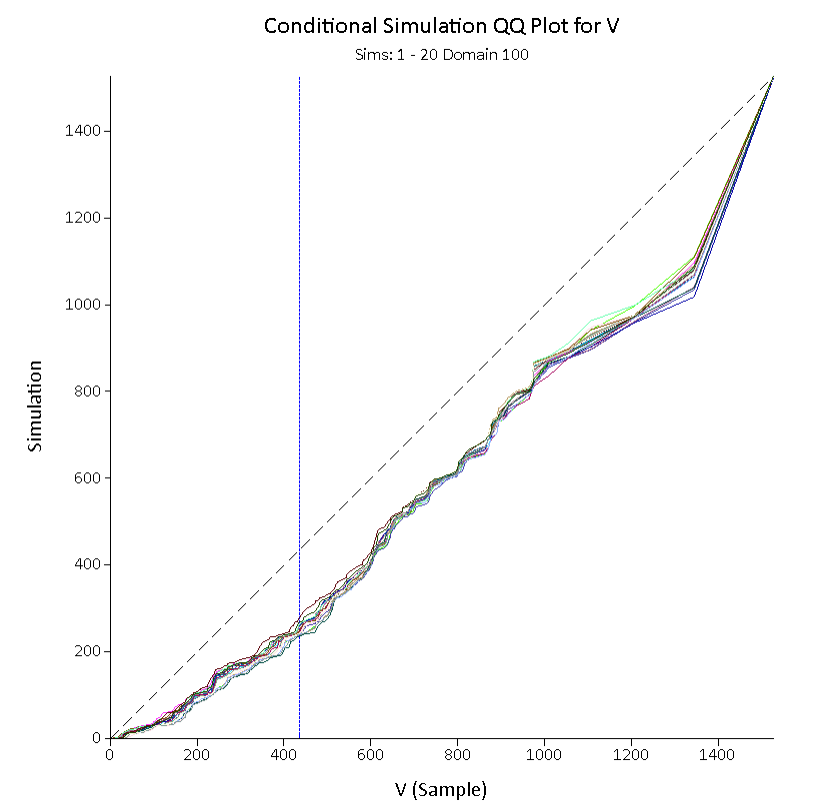
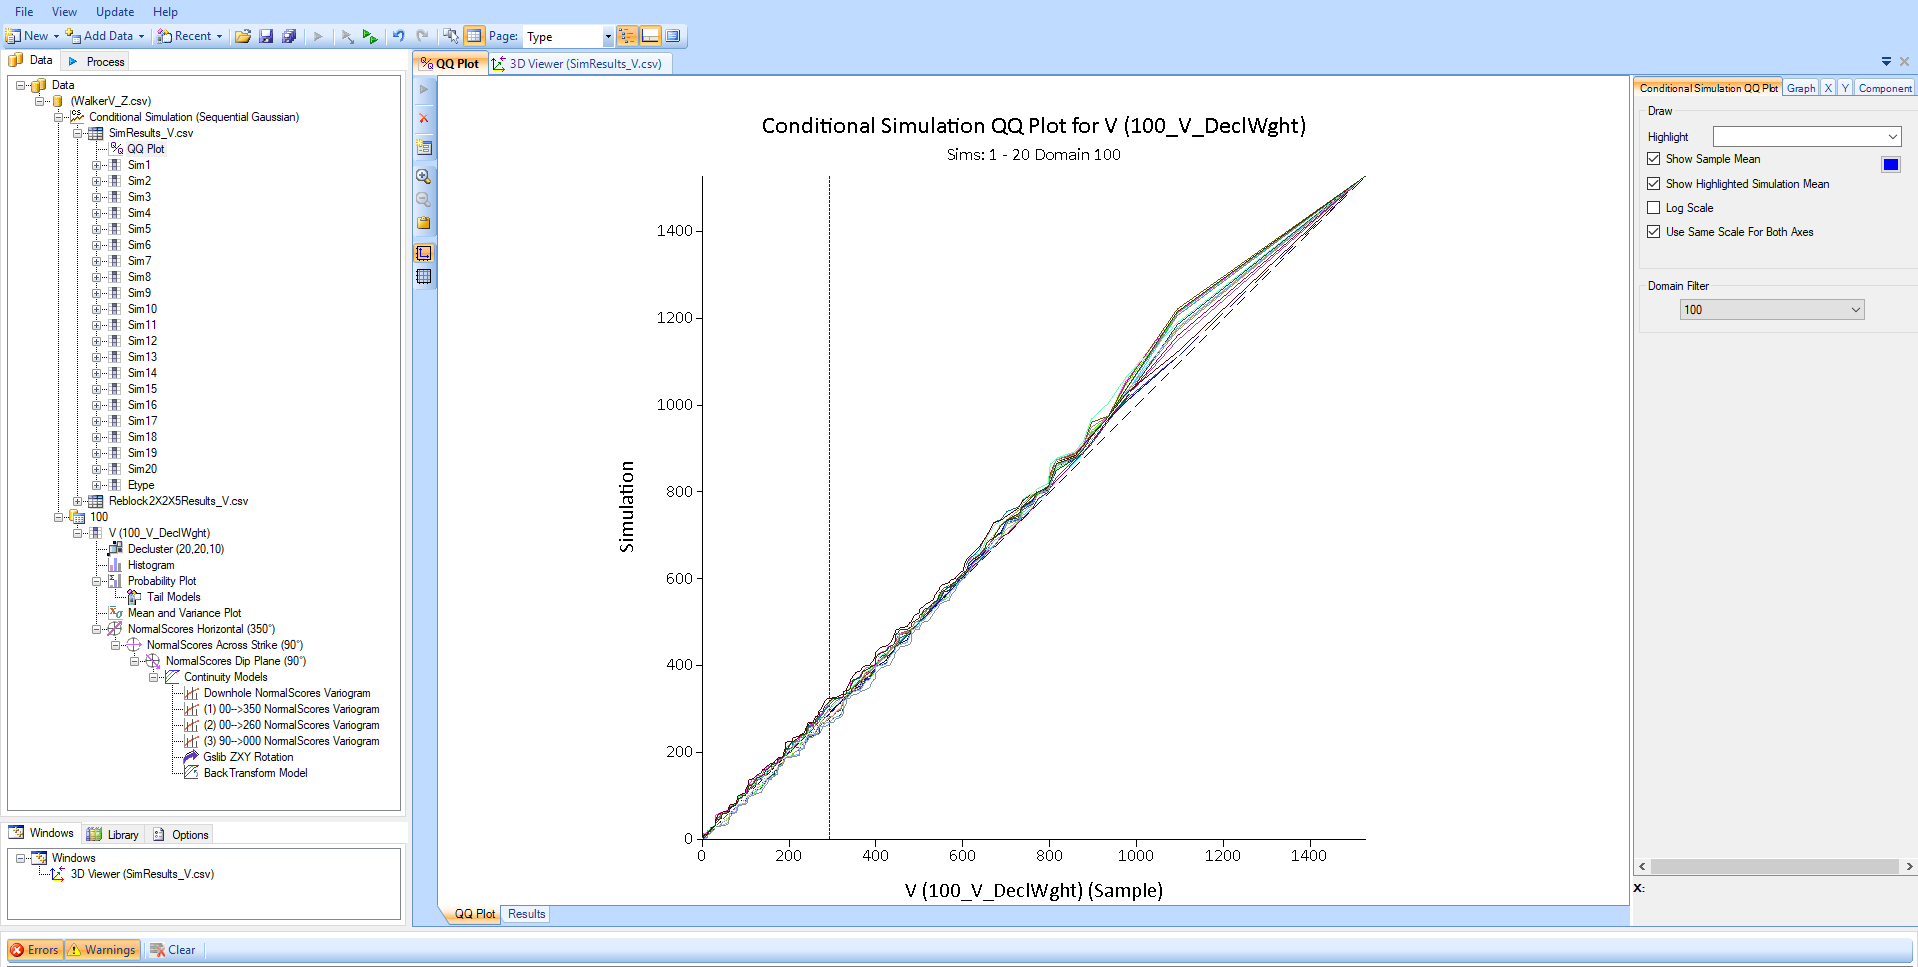
- Select and update the QQ Plot component in the Project Tree.
Note that the QQ Plot results are consistently below the 1:1 (dashed) line. This indicates a clustering error in the data, which needs to be addressed before continuing the simulation.
- Add a Decluster component to your data by right-clicking the V assay component in the Project Tree and selecting Add » Decluster from the menu.
-
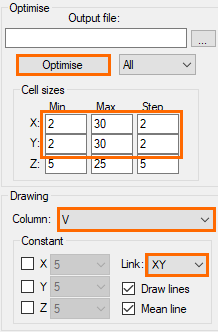
Open the Decluster tab in the Property Panel and change the following fields.
-
Change the Min, Max and Step values to 2, 30 and 2, respectively, for X and Y .
-
Select V as the Column.
-
Link the XY coordinates.
-
- Click Optimise.
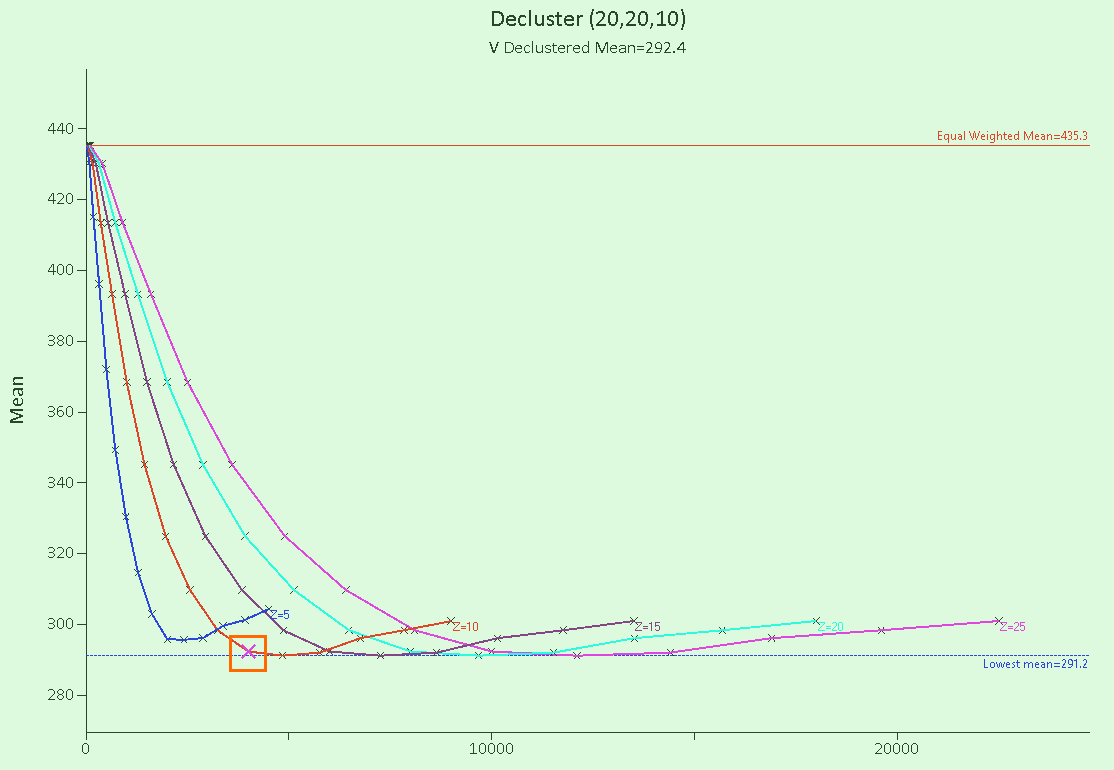
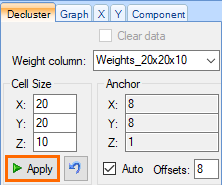
- Click the point on the Z=10 line, just before the line begins to plateau, as shown in the image below.
-
Click Apply beneath the Cell Size fields in the Decluster tab.
Your Conditional Simulation and Variogram components will require updating to match the new data.
- Adjust your variogram fan directions. These will have been reset after declustering the data.
- Select and update the Conditional Simulation component.
Your project should now look similar to the image below. Note how the Guassian mean and variance values (represented by the dashed lines) are much closer to the expected values of zero and one (represented by the solid lines), respectively.
- Select and update the QQ Plot component. Note how the simulated data now sits closer to the 1:1 line on the QQ Plot.
- Select the Reblock component in the Project Tree and click the Update Descendents
 button to update all of its child components.
The final simulations beneath the Reblock component can be assessed collectively using post-processing tools, such as grade tonnage curves and probability plots to generate probabilities for the volume and grade of material that may be obtained at different cut-off grades and in different parts of the deposit.
| «Previous |