
Conditional Simulation Components
This section describes the role of each of the components that are inserted as part of a conditional simulation.
Sim Results
The simulation results section contains simulated results of the 2D point data, before the data has been given volume.
QQ Plot
The QQ plot is used to compare the simulation values (Y-axis) with the original data (X-axis). Ideally, all simulations should sit close to the 1:1 line in the centre of the plot. Simulations consistently being grouped above or below the 1:1 line may represent clustering issues in the original data.
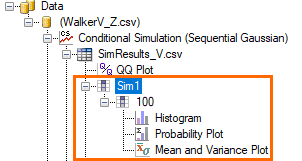
Sims
Each simulation component has the same standard histogram, probability plot and mean and variance plot that all new assays and domains have, displaying the data generated in the simulations.
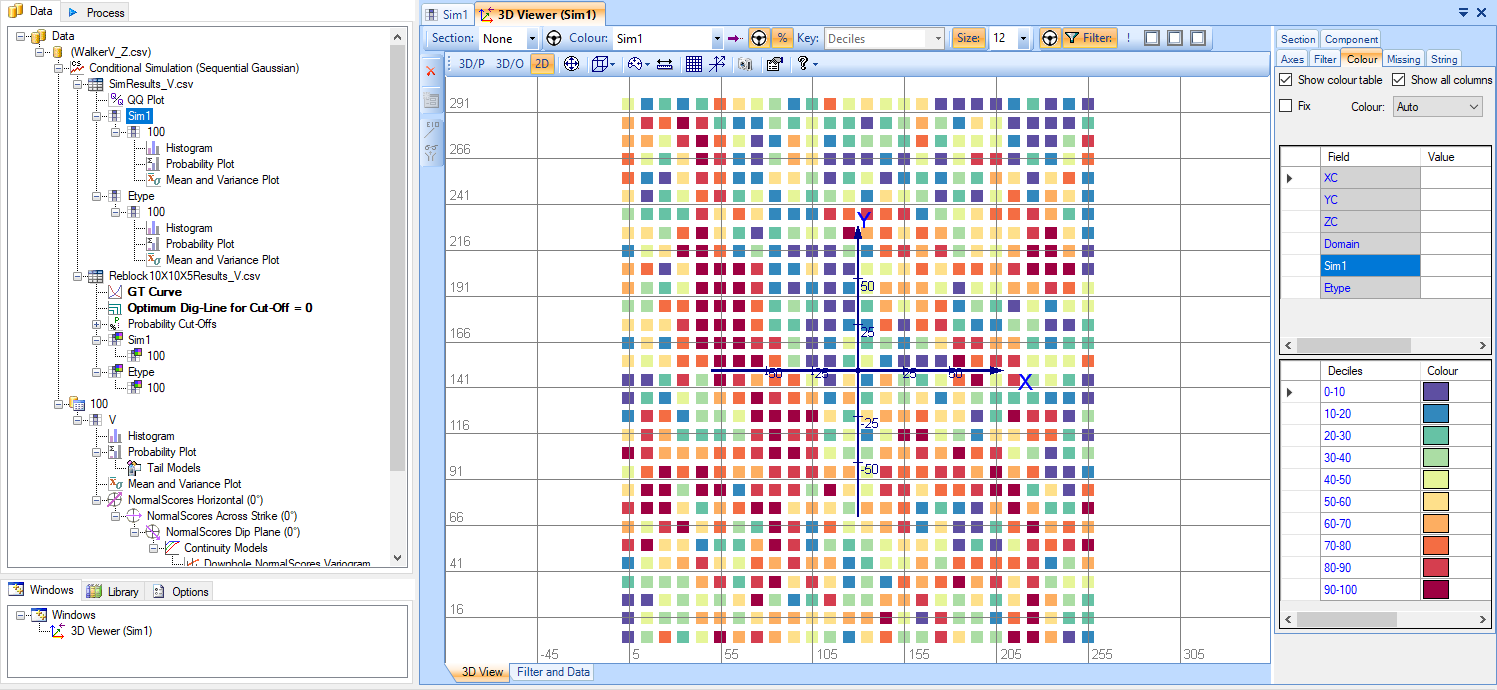
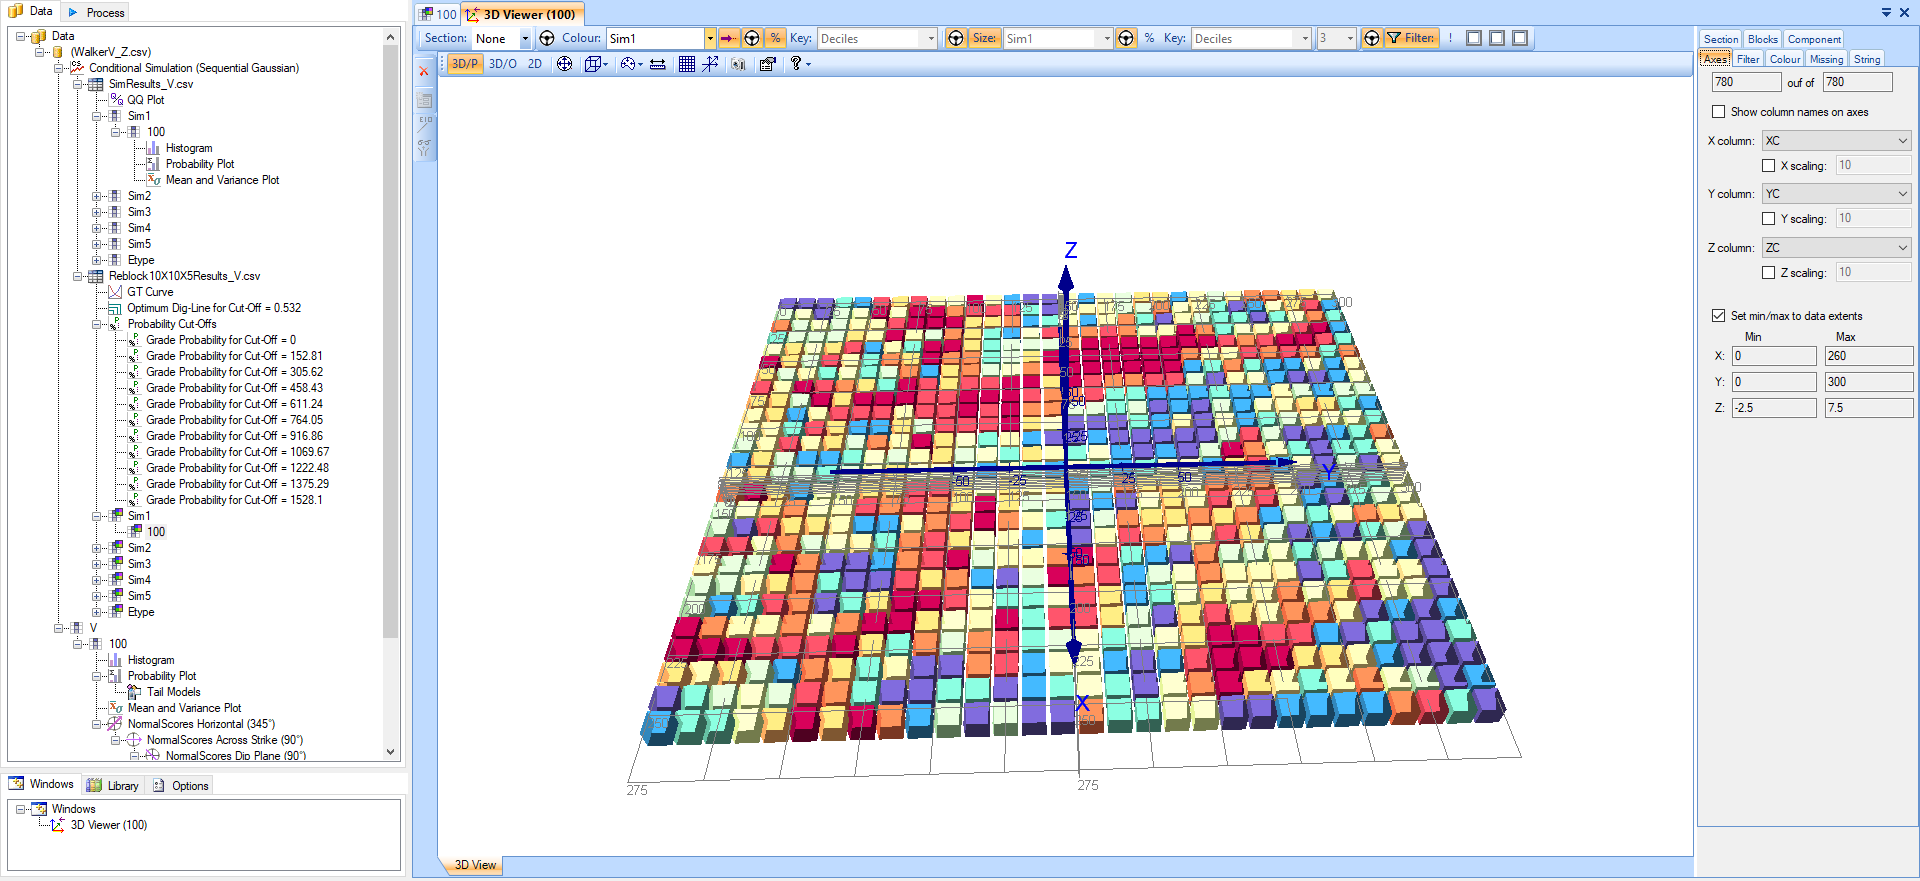
The value of the nodes in each simulation can be observed by selecting the simulation in the Project Tree and opening the 3D Viewer tab.
Notes:
Simulations in the Sim Results section of the Project Tree do not have volume. Each data point, or node, seen in the 3D Viewer represents a simulated value at a point in space. True 3D models are produced in the reblocked section below.
For a full explanation of viewing simulations in the 3D Viewer, see the next activity (Configure Conditional Simulation).
Etype
The Etype simulation is the average of all the simulations under the SimResults component. It contains the same components as the regular simulations and can also be viewed in 3D.
Reblock Results
The Reblock section contains results and components to summarise the data after it has been reblocked. Reblocking is the process of assigning the two dimensional point data to blocks, giving the data volume to create block models.
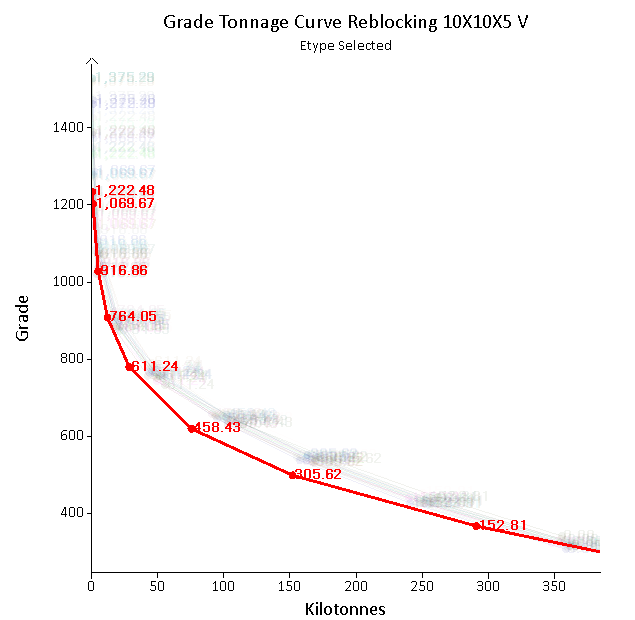
GT Curve
The GT (Grade Tonnage) Curve indicates the potential amount of material to be obtained at different cut-off grades.
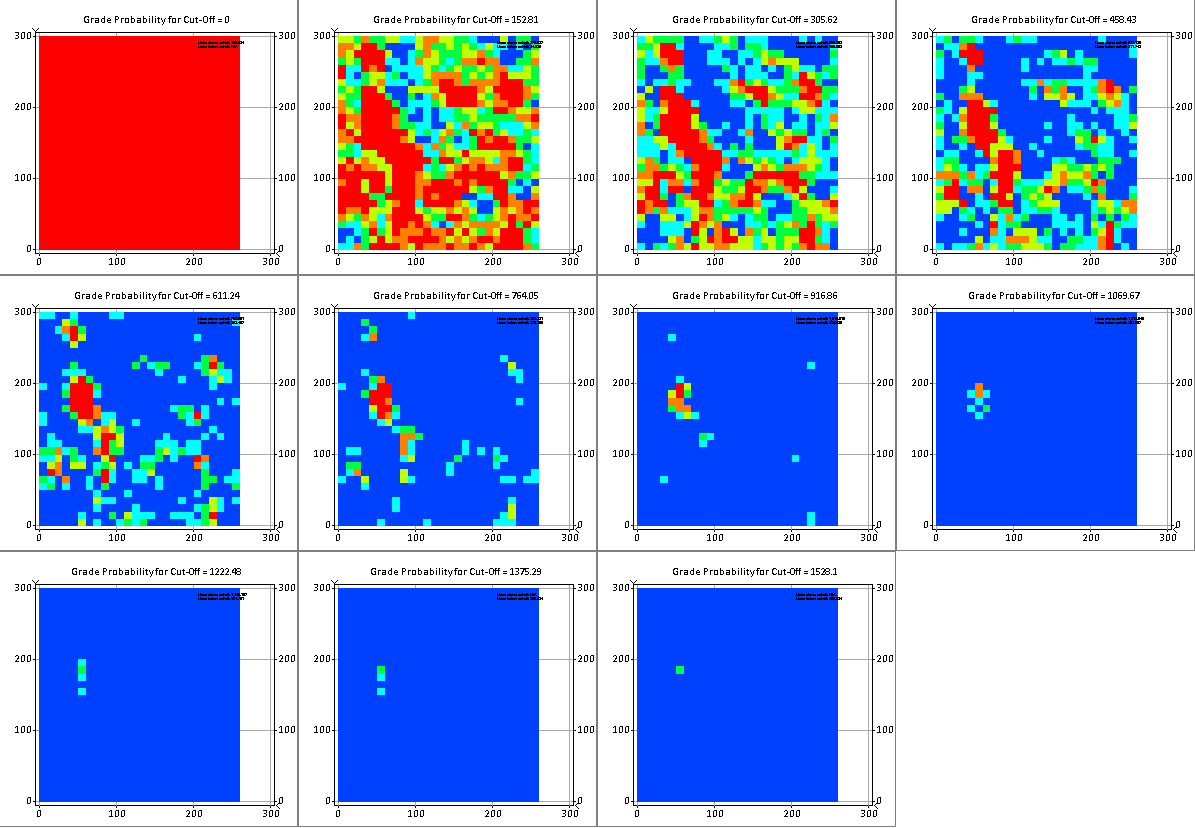
Probability Cut-Offs
The Probability Cut-Offs show the probability that the ore is above the specified cut-off grade. Multiple plots can be calculated for different cut-off grades to allow you to assess the risk involved with mining a specific area.
Sims
Unlike the simulations in the Sim Results section of the Project Tree, the reblocked simulations contain no components, apart from the 3D block model that can be viewed in the 3D Viewer tab.
Etype
The reblocked Etype simulation shows the average values of all of the other simulations.
| «Previous | Next» |