Load Data into Supervisor
In this activity you will learn how to load data into Supervisor.
- Before adding data to Supervisor, open the data analysis.csv file in Excel and view the spreadsheet layout. Note the columns that are present. This dataset is quite basic compared to those that you will usually work with. Your own datasets will likely contain multiple domains and assays, as well as other column types that are not present in this dataset.
- Add the data analysis.csv data file to Supervisor. To add data you can either drag it from your file explorer and drop it directly into Supervisor's Project Tree, or you can select Add Data » Point Data » Point Text from the top toolbar.
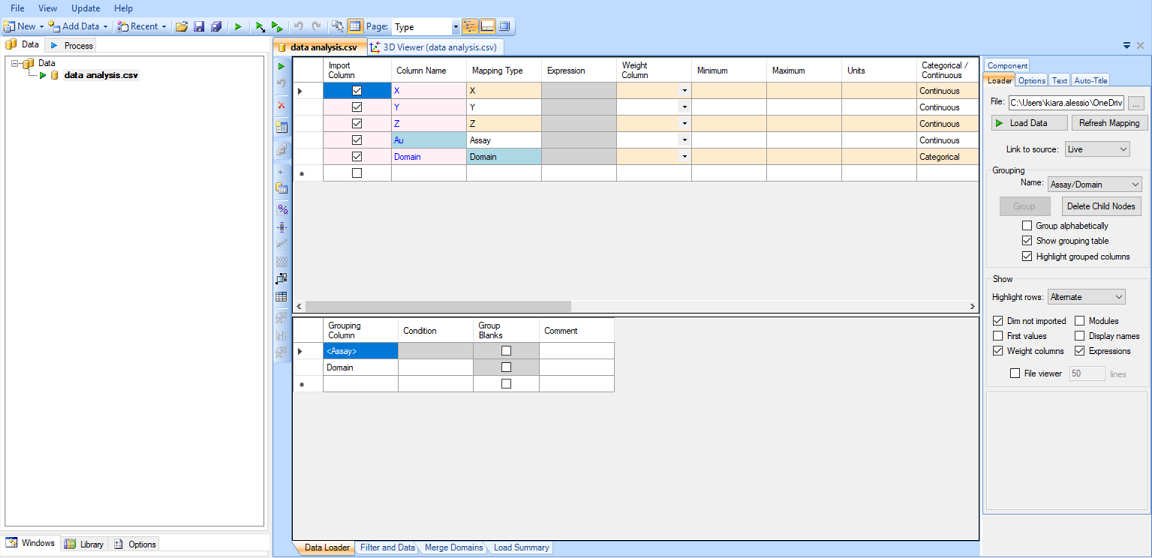
Your screen should look similar to the image below. Note that Data Loader component is shown in bold in the Project Tree. This means that the component needs to be updated, or in this case, loaded, to display the updated data. Before loading the data, let's take a more thorough look at the tables on the Main Canvas.

This is the Data Loader screen. Currently, the data has been added to Supervisor, but we haven't loaded it, so we can't use it for any analyses yet. Before loading it, we need to ensure the data columns are mapped correctly and select how to group the data.
- Assess the Column Definition Table in the top section of the Main Canvas, as shown below. This table contains the information on the columns to be imported and is automatically filled in when the source data is added to Supervisor. We are primarily interested in the following three columns.
- Import Column – Which data types are loaded into Supervisor.
- Column Name – The name of the column, as written in the original data file.
- Mapping Type –How the column is to be used by the analysis and display components. Some standard mapping types include spatial coordinates, assays and domains, as shown in this table, but there are many other mapping types available in Supervisor.
Note: A full explanation of every column in the Column Definition Table can be found here: Column Definition Table.

- Set the mapping types in the Column Definition Table as per the image above.
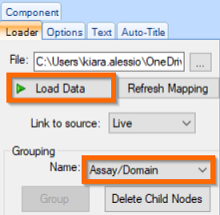
- Set your data grouping as assay over domain. To do this, select Assay/Domain from the Name menu in the Loader tab of the Property Panel, then click the
 Load Data button at the top of the Loader tab.
See Data Grouping Methods for a full explanation of how different grouping methods control the structure of your analyses.
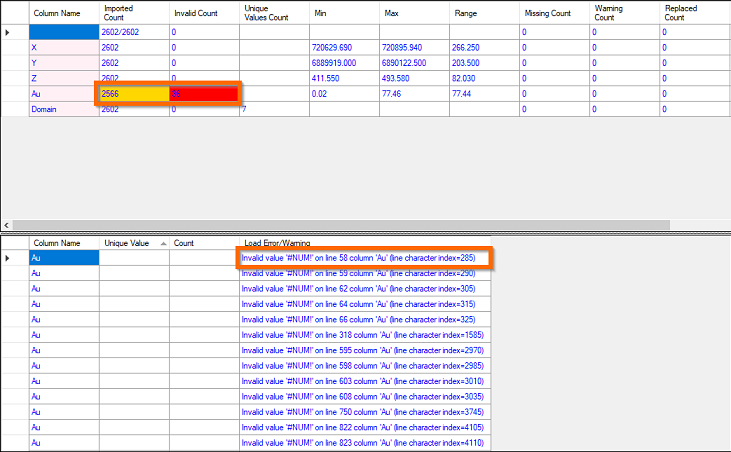
- After attempting to load the data, you will see an error in yellow at the bottom of the screen.

The tables in the Load Summary screen give more detailed information on why the errors occurred. Note the red cell next to Au in the Invalid Count column. The number in this column indicates that there are 36 invalid values assigned to Au in the original spreadsheet. The bottom table gives specific information on each load error. This table indicates that the invalid value '#NUM!' is present in a number of fields. Supervisor is unable to process this value, so you will need to change it in the data file.

- Open the spreadsheet, then search for and delete all instances of '#NUM!' so that the cells are empty. Save the new data file as data analysis correct.csv.
- Repeat steps 2–5 above to load the new data into Supervisor.
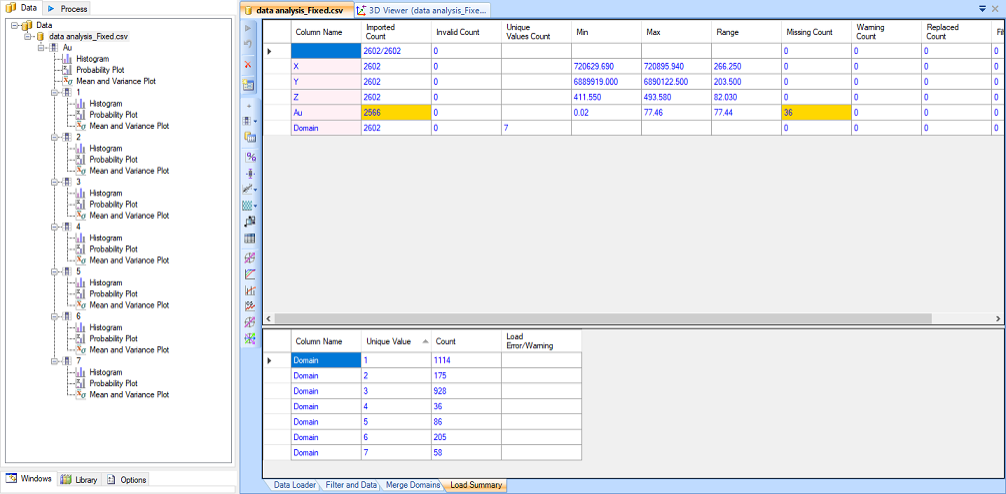
- Click the + symbol next to Au in the Project Tree to see all of the domains (numbered 1–7) beneath the assay (Au).
Your screen should look similar to the image below.

- Note that each assay and domain has three basic plots automatically inserted beneath them: the Histogram, Probability Plot, and Mean and Variance Plot. Click on any of the plots to display them in the Main Canvas.
You have now loaded data into Supervisor. From here you can assess the basic plots, or insert new components to continue onto other areas of exploratory data analysis.
Note: You can edit or regroup the data and reload it at any point by selecting the Data Loader component in the Project Tree (represented by the name of the data file) and opening the Data Loader tab at the bottom of the Main Canvas.
| «Previous |

