Insert and Configure Continuity Models
Variogram modelling involves fitting a mathematical model to match to the experimental variogram. This is done by defining the nugget and up to three nested structures such that the combined model fits the data shown in the continuity models.
Insert Continuity Models
- Right-click the Dip Plane variogram fan and select Add » Continuity Models from the menu.
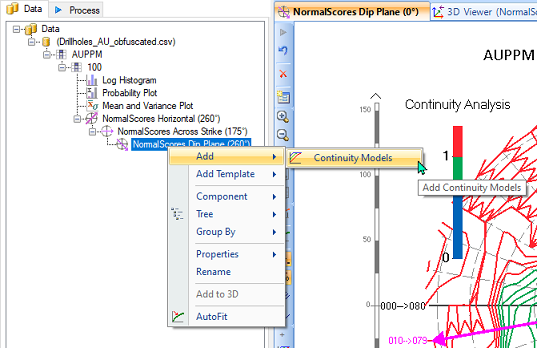
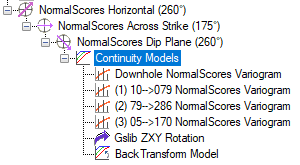
The Continuity Models component automatically inserts several child components, including the:
- Downhole Variogram – Used to set the nugget for the directional variograms.
- Directional Variograms – Used to fit the variogram model to the data.
- Rotation – Used to configure variogram data for export into another software package.
- Back Transform Model – Added to transformed variograms to back transform the variogram model parameters so they may be used in the original data space.
Set the Nugget
- Select the Downhole Variogram from the Project Tree.
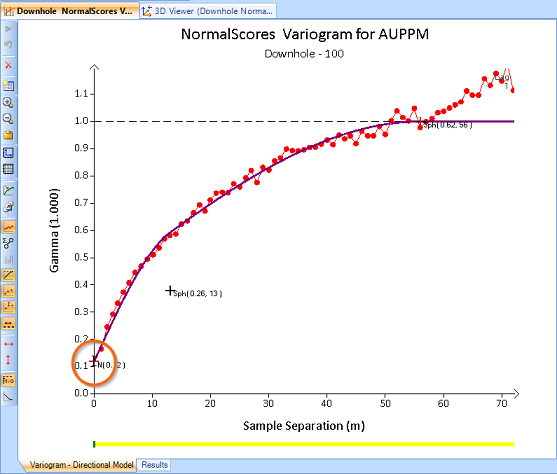
The downhole variogram is used to set the nugget before configuring the rest of the structures on the other variogram models. It is a special variogram that uses the Hole ID as a filter so that pairs are only selected from the same holes. These pairs provide the best variance values for very small separation distances.
- Click and drag the handle (+ icon labelled N) along the Y-axis to line the nugget structure up with the point where the data would intercept the Y-axis.
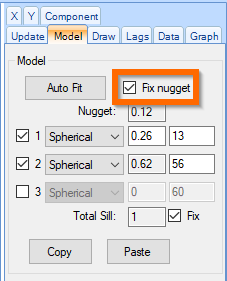
- Open the Model tab in the Property Panel and ensure the Fix Nugget checkbox is turned on.
This prevents the nugget from being moved while adjusting structures on the directional models.
Set the Structures
- Select the Continuity Models component and select the Variograms tab at the bottom of the Main Canvas.
This simultaneously displays all the directional variograms in the Main Canvas, which allows you to assess how altering the structures affects each model.
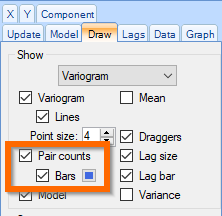
- Open the Draw tab in the Property Panel and tick the Pair Counts and Bars options.
This allows you to see how many sample pairs make up each data point on the variogram and can help you decide on an appropriate sample spacing for fitting the model.
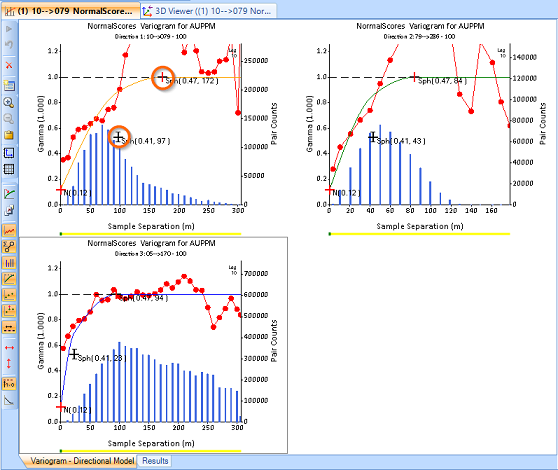
- Click and drag the yellow bar at the bottom of each variogram to adjust the sample separation (lag).
Similar to the variogram fans, adjusting the lags can result in noisier or smoother changes in the variogram value between contours. Generally, the variogram is easiest to interpret when the sample separation increments are approximately the same distance as your drillhole spacing.
- Click and drag the structures (+Sph for a spherical structure) on any of the models in the Main Canvas to fit the models to the experimental variogram points as best as possible.
The sills of all structures are linked across all three directions, so changing the sill of one structure (up and down), also moves the structure in the other two directions.
Export Continuity Models
After you have fitted the model, you are ready to export the variogram model parameters.
- Select the Rotation component in the Project Tree.
- Open the Axis tab in the Property Panel and select which software package you need the data to be compatible with from the Compatibility menu.
- Depending on the Compatibility type selected, you may also need to select the required Rotation Type and Dir 1 Axis.
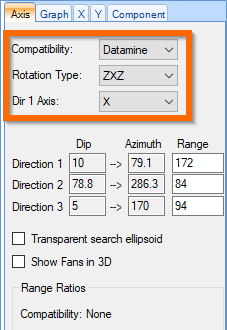
- Depending on the Compatibility type selected, you may also need to select the required Rotation Type and Dir 1 Axis.
- Select the Back Transform Model component in the Project Tree.
This component is only present when a normal scores transformation has been applied to the variogram models. If the data is not transformed, the export is conducted from the Continuity Models component instead.
- Right-click the Back Transform Model component in the Project Tree and select Export from the menu.
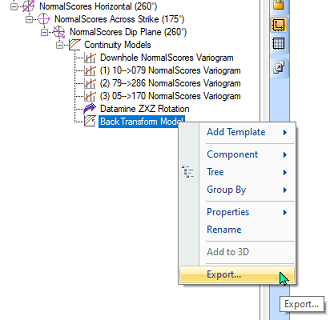
- Select where to save your model parameters and click Save.
The data is now ready to be imported into other software and used for further estimation.
«Previous

