Insert and Configure Variogram Fans
After loading in the data, you need to insert and configure your variogram fans to set the direction of maximum continuity and orient the variograms for modelling.
Insert the Horizontal Continuity Fan
- Add a Horizontal Continuity Fan to the 100 domain by right-clicking the domain and selecting Add » Horizontal Continuity Fan from the menu.
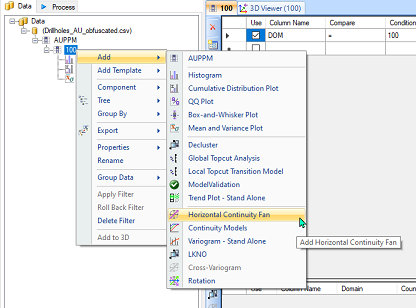
The horizontal continuity fan component is inserted beneath all other components under domain 100. Note that the component has a green background in the Main Canvas. This means that it requires updating.
- Click the update
 button, either in the Property Panel or on the Main Toolbar, before altering any settings.
Your variogram should look similar to the image below.
Note: Any previously changed defaults will cause the output to appear different. If no contours display, check the Standardise gamma values option in the Fan tab of the Property Panel.
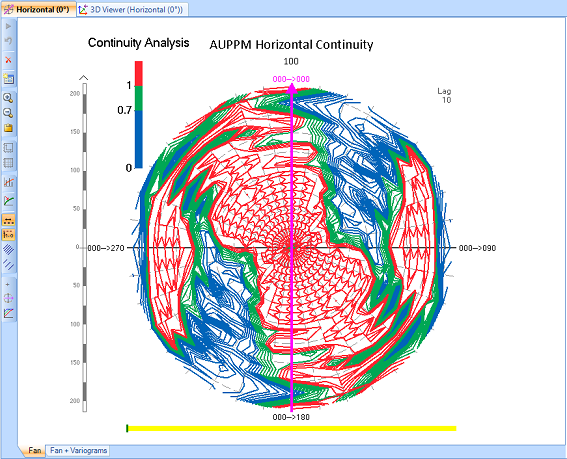
When selecting the direction of maximum continuity on a variogram fan, contours should generally start at blue in the centre, then extend out to green, then finally red. These colours correspond to the variogram value of the sample pairs, with red contours relating to values that exceed the sill. In this example, the inner part of the fan is primarily red. This indicates that, even at very small separations, the variability of the pairs is greater than the total sample variability. This is typical of highly skewed datasets and a transformation may need to be applied to the variogram before undertaking continuity analysis.
- Open the Histogram for this data to assess any trends.

A high proportion of the data on this histogram is grouped in the lower value ranges of the population, incicating a positively skewed distribution. Applying a logarithmic scale to positively skewed data can help normalise its distribution and make further analysis easier.
- Tick the Log checkbox in the Histo tab of the Property Panel.
Where the log-transformed data appears normal, we refer to the distribution as log-normal. This is a good indicator that a normal transformation of the data will assist the interpretation of your variogram fans.
- Open the Horizontal Variogram Fan again and select the Normal Scores transformation from the Transform section of the Update tab.
- Click the update
 button to see the new contours with the normal scores transformation applied.
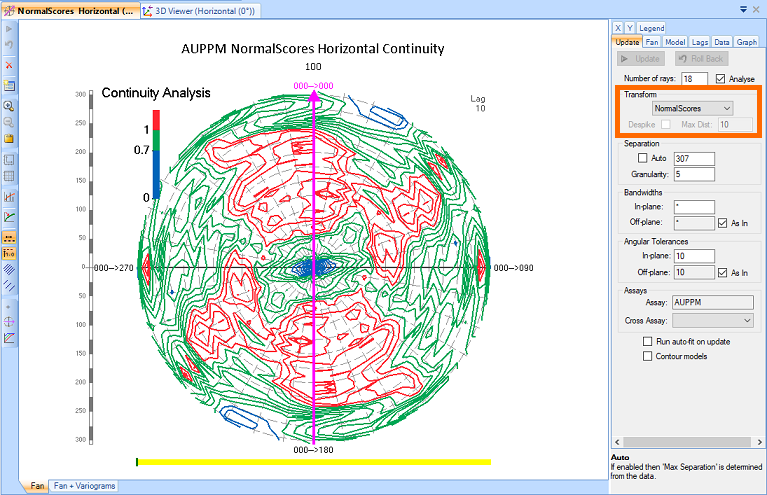
Now the variogram fan pairs have lower gamma values for pairs at small separations, with blue contours near the centre of the fan, increasing to green and then red as the move away from the centre of the plot.
Configure Variogram Radius and Lag Spacing
Before selecting the continuity direction, it is important to configure the variogram fan view to improve your ease of interpretation.
- Adjust the lag size by clicking and dragging along the yellow bar at the bottom of the Main Canvas, beneath the variogram fan. For this activity, adjust the lag size to 25.
The lag value is shown in the top right corner of the Main Canvas.
The lag size sets the increments at which the sample pairs are calculated (that is, the distance between contours) and controls the level of detail in the variogram fan. Set the lag size to a distance where the contours still create a detailed image, but are not too noisy. It may be useful to zoom in on the area of interest in the middle of the fan, by clicking and dragging the upper portion of the scale bar to the left of the variogram fan.
- Adjust the variogram radius to be 150 metres by clicking and dragging on the upper portion of the sale bar to the left of the variogram fan. Your variogram fan should look similar to the image below.
The exact lag size and radius of the variogram fan required to easily interpret the direction of greatest continuity are subjective and require you to experiment and use your own judgement and knowledge of the geology you are working with.

Configure Angular Tolerance and Bandwidths
The angular tolerance and bandwidth of a variogram fan change the effective search area Supervisor uses to find sample pairs. A larger search area generally produces a smoother fan because the search area of each direction will begin to overlap with neighbouring directions.
- The Bandwidths are initially set to infinity, but can be set to any positive value. For this dataset, changing these values does not significantly alter the variogram fan.
- The Angular Tolerances can be set to any value between 0 and 90 degrees. Change the in-plane value to 1, then to 30 and back to 10 and observe the difference it makes to the fan each time you update it.
Select the Direction of Maximum Continuity
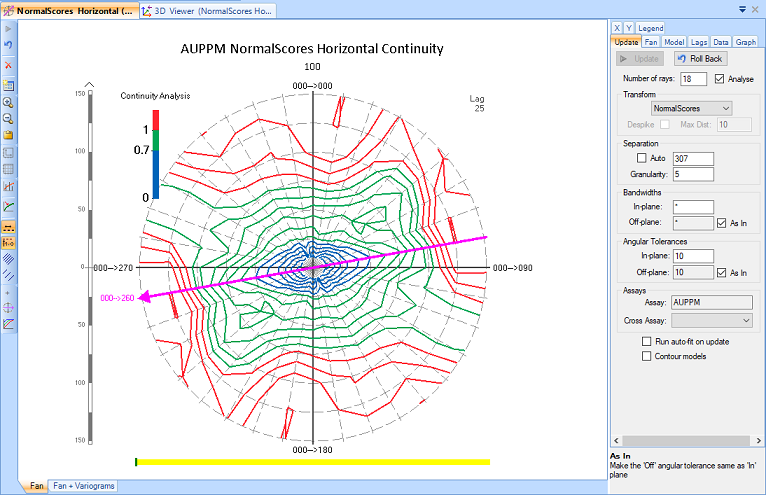
- Click and drag the pink arrow on the variogram fan to select the direction of maximum continuity. Variogram fans are bi-directional, so select either 000-->080 or 000-->260 for this fan, as in the image below.
Insert and Configure Remaining Continuity Fans
Once the horizontal continuity fan has been configured, you can insert the second fan.
Note: Each new fan uses the direction selected in the previous fan to determine the orientation of the new plane. Altering a variogram fan with child components will require you to reconfigure all child components.
- Right-click the Horizontal fan in the Project Tree and select Add » Across Strike Continuity Fan from the menu.
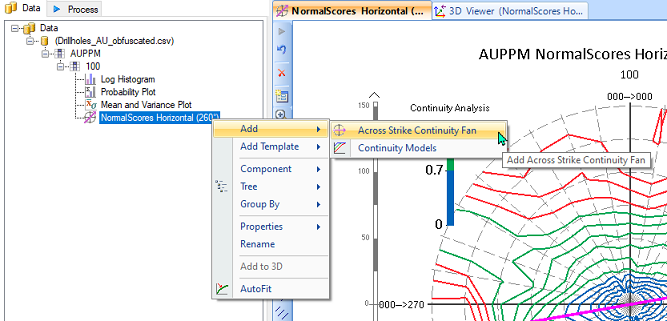
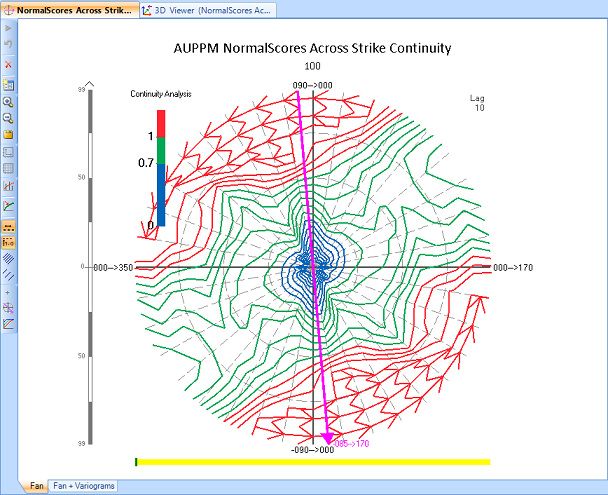
- Using the same steps as above, configure the variogram fan and select the direction of maximum continuity. For this fan, select 085-->350 or -085-->170.
Note that the normal scores transformation is automatically applied to all fans after being selected on the first.
- Right-click the Across Strike fan in the Project Tree and select Add » Dip Plane Continuity Fan from the menu.
- Configure the variogram fan and select the direction of maximum continuity. For this fan, select -010-->259 or 010-->079.
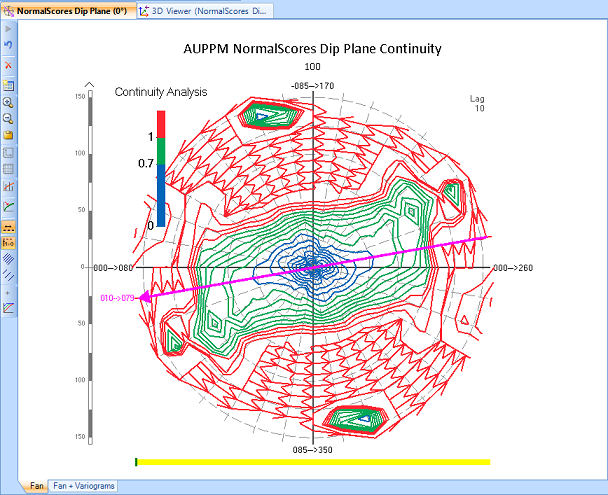
Now that all three variogram fans have been configured, the directions of continuity can be calculated and variogram modelling can commence using the Continuity Models component.
Note: Continuity models can be inserted beneath any of the variogram fans at any stage. For example, if your deposit is horizontally bedded, without any dip or plunge, you could insert the continuity models beneath the horizontal fan.
«Previous Next»

