
Crosstab View
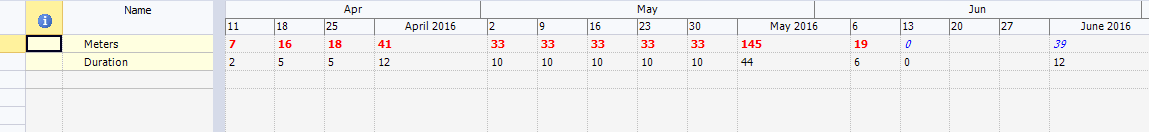
The Crosstab view is used to display fields (mainly production and summary) and resource loading in the same time intervals as the bar chart.
The view uses colour coding to highlight where production values fall outside of the targets, or resources are overloaded. In the following example green italic text shows production below target, and bold red text shows production above target. Resource scheduled over capacity is also shown in bold red.
The cross tab view first display all the totalled fields, followed by the list of resources.
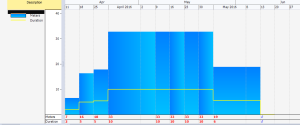
The cross tab can also display:
-
a histogram of all selected totalled fields, for example:
-
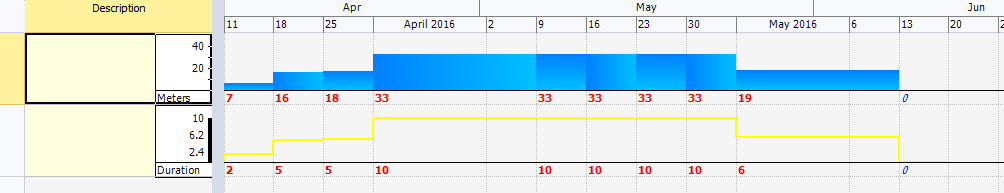
a histogram for each field and resource:


Related topics and activities