
Create a Dashboard
Dashboards are a useful way to present summary schedule and resource information in DTS.
The following activities require Dashboard Design Mode to be active.
To toggle Dashboard Design Mode on or off:
-
Right-click an empty part of any dashboard.
-
Select Design Mode to toggle this state on or off. If on, a tick appears next to the menu entry.
Create an Initial Dashboard
To create a dashboard in DTS:
-
View ribbon >> Create New View >> Dashboard.
-
Populate your dashboard.
-
Right click an empty space on the view.
-
Select Add Item.
The Dashboard Report screen displays.
-
Define your dashboard item Details, Datasource and (optionally) a Filter. See below.
-
-
Click OK to populate your dashboard item with initial data.
A new dashboard item displays.
-
Right-click the dashboard item and select Chart Designer.
The Chart Designer screen displays.
-
Use the Chart Designer screen to enhance your chart with annotations, a legend and set the visual formatting and other properties. See Chart Designer.
Note: You can also create a new dashboard when any dashboard is displaying using Home ribbon >> Dashboard >> New.
Add Dashboard Items
To add dashboard items using the Dashboard Report screen:
-
Display the dashboard you want to edit.
-
Right click an empty space on the view.
-
Select Add Item.
The Dashboard Report screen displays.
Note: You can also add a dashboard item by displaying a dashboard and selecting Home ribbon >> Layout >> Add Dashboard Item.
Tip: Disable Design Mode and left-click-drag to rotate the view of 3D dashboard items. See Dashboard 3D Item Key Shortcuts.
Format and Add Dashboard Item Components
For full control over existing chart dashboard items, use the Chart Designer to change how your data is presented, including the chart type, reporting data items, colours and on-screen position.
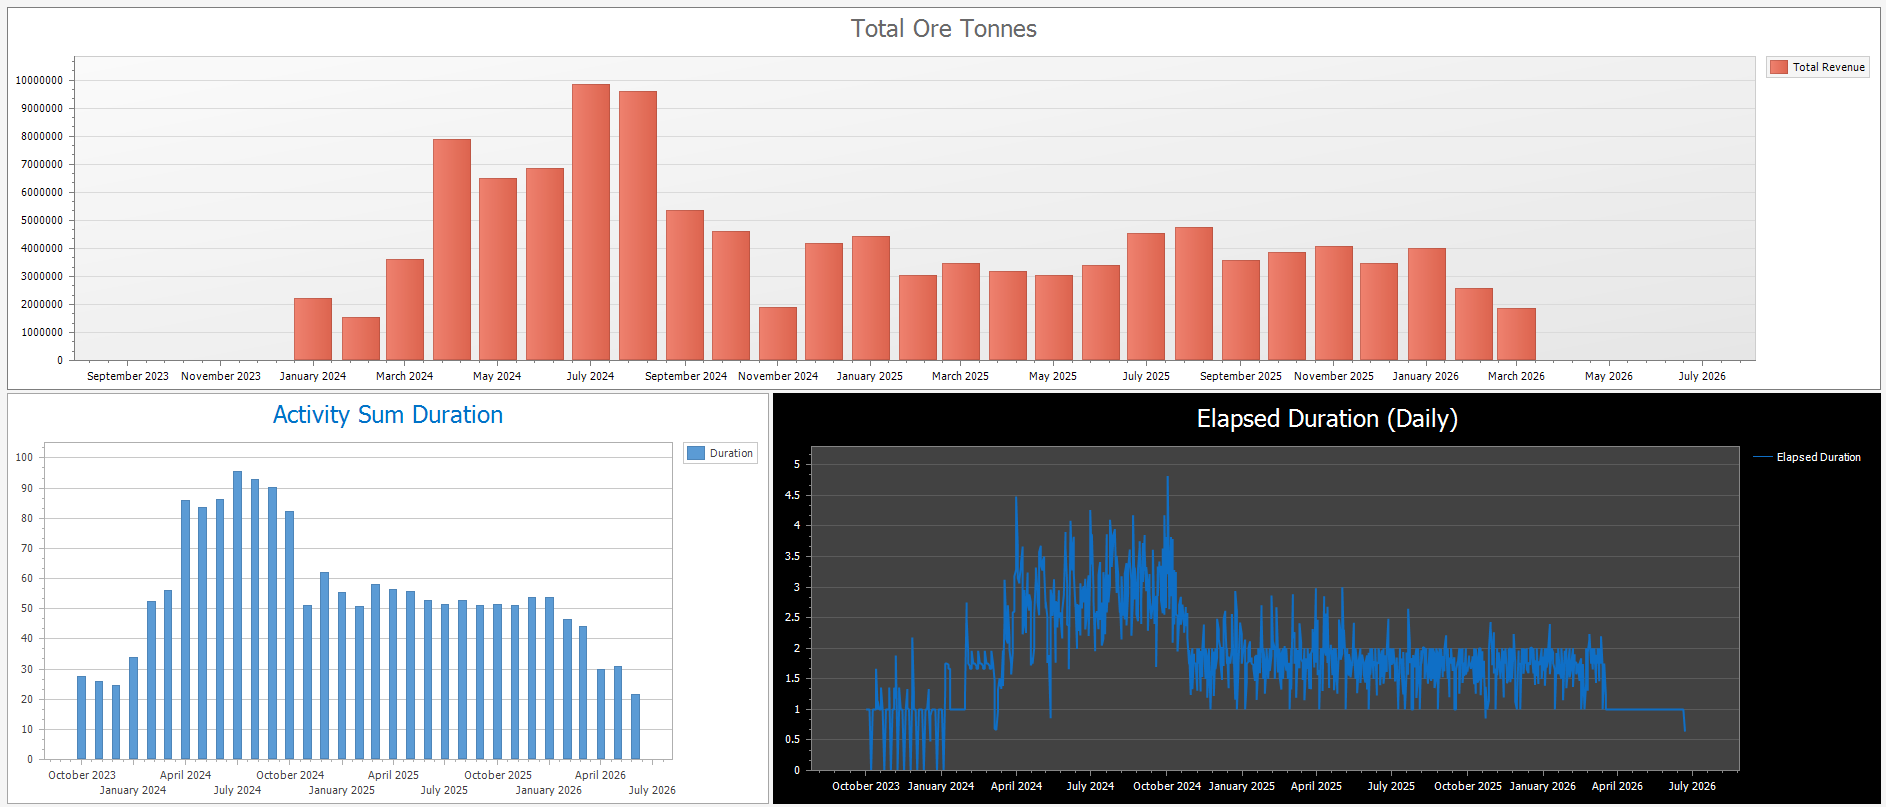
The Chart Designer offers several options for chart formatting
You can also use the Dashboard Report screen to adjust the basic chart type, data source and filters for a dashboard chart.
Tip: Start with the Dashboard Report screen to add the chart item and fine-tune it later using the Chart Designer.
You can also make quick changes using the Home ribbon (this is a custom ribbon that displays when a dashboard tab is active), such as making bar widths thinner or thicker:
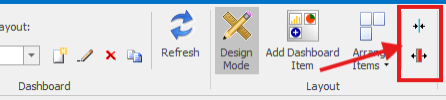
Aligning dashboard items is also straightforward, using the Arrange Items menu to pick a grid layout.
Related topics and activities