
Display Logs
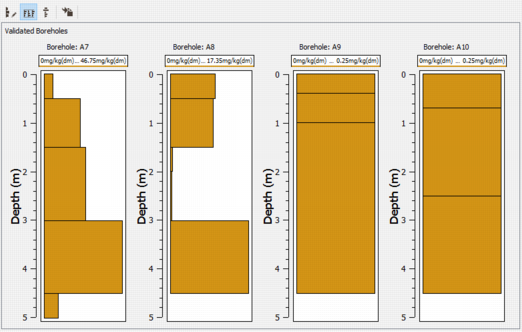
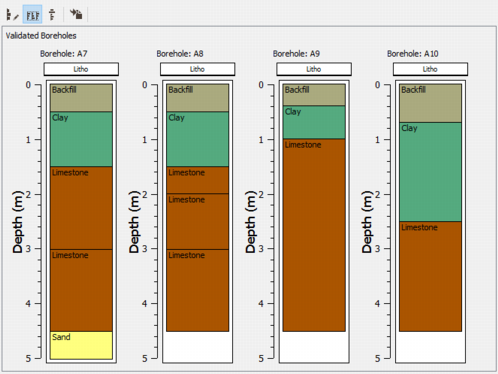
The Display Logs representation allows to visualize information collected along boreholes projected on a 2D plane.
The Display Logs is available if the current layer![]() .
.
By default, the Display Logs view loads the measure variables found in the samples support of the boreholes but only the three first ones are activated and represented in the view.
-
 Click Edit Properties to pop up the Log Template Window and modify the representation properties.
-
 Click Synchronize Y Axis to define the same bounds for all the vertical axes. The synchronization allows to compare the different boreholes.
-
 Click Titles on Two Lines to put track titles on two lines instead of one. In this mode, the first line will display the track item name (i.e. the variable name) and the second line will have the minimum and maximum values.
-
 Click Send log to report to send the display log to the Reporting Window.
Log Template Window
Click Edit Properties to pop up the Log Template Window and modify the representation properties.
The Display Logs can contain several tracks, each one potentially containing several items. The list at the left and the toolbar allow to organize, create and delete the different tracks and items.
-
 Click Add Track and define a new track and a new item.
-
 Click Add Track Item to load a new item in the current track.
-
 Click Delete to remove the current track or item.
-
 Select Move track/item Front to put the current track or item at the top of the stack.
-
 Select Move track/item Back to put the current track or item at the bottom of the stack.
-
 Click Reset Template to Default to restore the default template managed by Isatis.neo (i.e. the three first measure variables contained in the project).
-
 Click Save Template to store the template for future use.
-
Editing Track:
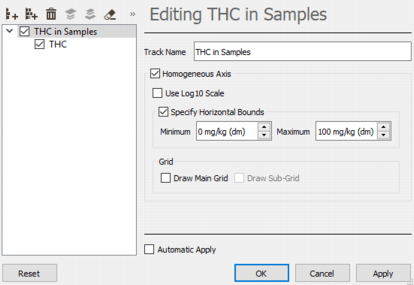
- Track Name: Enter the name of the track.
- Homogeneous Axis: Ticking this option, you will define the same horizontal bounds for all the items of the current track. The default bounds are based on the minimum and maximum values of all the items.
- Use Log10 Scale: Tick this option to display the log of the Log10 transformed variable. This option can only be used with Homogeneous Axis, meaning you cannot mix different Log10 track items in the same track. You can still obviously use separate tracks to achieve quite the same result.
- Specify Horizontal Bounds: If the Homogeneous Axis option is activated, you can enter a minimum and a maximum value for the horizontal bounds.
- Grid: Select the Draw Main Grid option to display a grid in the display logs and the Draw Sub Grid option to display a subgrid. You can not access the subgrid if the main grid is not activated.
-
Editing Item:
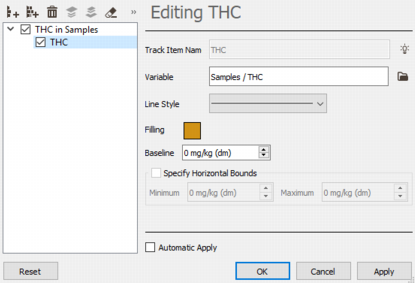
- Track Item Name: Defines the track name. By default, you cannot modify its value because it is automatically set to the variable name. To set a different track name untick the Automatic
 option.
 - Variable: Click Open a Data Selector
 to pop up a variable selector and to define the variable on which you want to display logs.
 - Line Style: Edit the Line Style by setting a Style, a Color and a Width.
- Filling: Click the colored square to pop up a Color Selector and to modify the filling.
- Baseline: The baseline is needed for filling a curve with a given color. It is interpreted as a vertical line with x=baseline.
- Specify Horizontal Bounds: This option is only available if the Homogeneous Axis toggle is not activated. Tick Specify Horizontal Bounds and enter a minimum and a maximum value to fix the horizontal bounds of the current item.
Selecting an auxiliary categorical variable, the filling is deactivated and the colors defined by the catalog is then applied to the different categories of the variable. A Transparency slider allows the adjustment of the transparency level. Thanks to this option it is possible to superimpose several categorical variables or a categorical variable and a numerical one below.
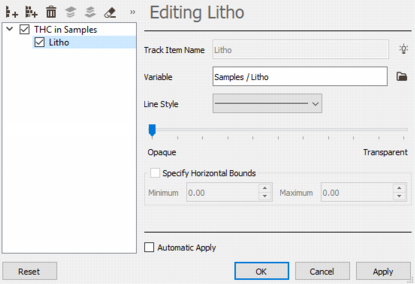
Note: A warning zone informs the user about potential issues of superimposing categorical variables or categorical and numerical variables.
- Track Item Name: Defines the track name. By default, you cannot modify its value because it is automatically set to the variable name. To set a different track name untick the Automatic
- Tick Automatic Apply to automatically apply the track/item properties modifications.
- Click OK to close the window applying the modifications.
- Click Cancel to close the window without applying the modifications.
- Click Apply to apply the modifications without closing the window .
- Click Reset to undo the modifications.