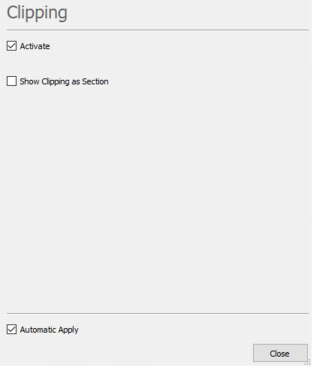
Clipping Property
If activated, this property enables the clipping of the object.
The clipping is reachable thanks to the icon ![]() on the 3D Viewer Tool Bar.
on the 3D Viewer Tool Bar.
When a 3D grid is selected, it is possible to display the content of each cell as a label.
Sparse grids and sub-blocks do not support this property.
The following parameters are then available:
- Show clipping as section: Tick this option to visualize the clipping section as a slice. In this mode, labels are displayed on both sides of the slice.
- Fill cell background (enabled by default): Activated the filling of each cell with its corresponding color. If disabled, only the cell borders are displayed and colored.
- Exaggeration: Adjusts the spacing between cells. By default, the cells are adjacent, but you can exaggerate to add space between them for clearer delineation.
-
Label (enabled by default): Enables the display of labels inside each cell:
- Variables: Select the variables whose content you want to display in the labels. All variable types are supported. To display a variable, it must first be selected as an input variable. Each selected variable is referenced as V# (e.g.: V1, V2, …, Vn), depending on its position in the input variable list. These shortcuts must then be used in the Pattern section to define the label content.
-
Style:
- Choose a Font (with live preview in the display),
- Set a Size in pixel between 0 and 99,
- Pick a Color using the Color Selector.
-
Options:
- Show Unit: Display the unit of the selected variable,
- Background: Add a background color to the label.
Note: To ensure smooth performance when a very large number of cells / labels must be displayed, the software automatically applies a display filter. This filter limits the number of elements shown simultaneously, preventing slowdowns or visual clutter.
As you zoom in, the display is progressively refreshed to reveal more detail. Once you reach a sufficient zoom level, all labels become fully visible. This approach provides an optimal balance between performance and readability, allowing you to explore your data efficiently at any scale.