
Picking Table
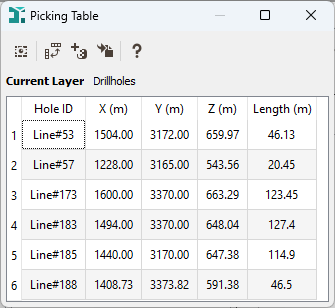
The Picking Table functionality allows the display of information associated with objects selected into the Map Window or in the 3D Viewer.
The printed information is displayed in a dedicated tab on the right side of the interface. This tab appears as soon as one or more objects are selected using the available picking actions. It can be resized and minimized by clicking on the arrow. The "hidden" state of the tab is saved when the picking table is deactivated/reactivated.
The behavior of the picking table is slightly different in the Map Window and in the 3D Viewer:
-
In the Map, the Display Data Informationfunctionality requires the selection of a layer to activate it. You can only pick and display information associated with the current layer. Only one table will be available at a time.
Select in the layers list the layer on which you want to display information. Then, interactively select the objects of your choice thanks to the selection tools
 or
or  .
. - In the 3D Viewer, you can pick and display information from several items visible in the scene simultaneously. The number of tables will match the number of data tables containing selected objects.
Finally click ![]() Display Data Information in the Map Window Tool Bar / 3D Viewer Tool Bar to see the different variables associated to the selected objects.
Display Data Information in the Map Window Tool Bar / 3D Viewer Tool Bar to see the different variables associated to the selected objects.
As this tool is synchronized with the current selection, you can change the selection by adding new points for example, the displayed information will be automatically modified.
-
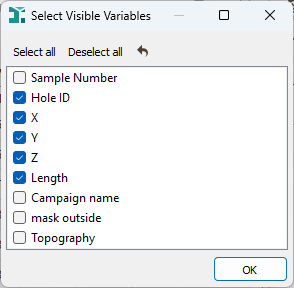
 Click Visible Variables to edit the list of the displayed variables. You can tick/untick each variable that you want to display or not.
- Click Select All to select all the variables.
- Click Deselect All to deselect all the variables
-
Click
 to reset the automatic list of displayed variables.
-
Click Pick in the current item (only in the 3D view) to select samples corresponding to the item highlighted in the scene items list only.
-
 Click Switch columns and rows to invert the table order. By default, variables are displayed as columns and a row represents a sample.
 -
 Click Create selection from picked samples to save the selected samples as a selection variable which will be visible in the Data Explorer (under the corresponding data table) and which could be used in the different tasks. A sub-window is popped up to ask you to define a name for the selection.
 -
 Click Clear selection (only in the 3D view) to clear the selection in the corresponding item. Previously selected samples will be unselected and the table will be empty.
 -
 Click Send data to report to send the content of the table to the Reporting Window.