
Input
This section is divided into four parts: Data, Domains definition, Orientation and Computed perspectives. Each section can be hidden by clicking on the section title.
Data
The variable on which is applied the analysis can be in 2D or 3D, and be in drillholes, points or a grid file.
- Click the directory icon to pop up a Data Selector and select the input Data table on which you want to perform the border analysis. This data table can also be defined by a simple and quick drag-and-drop from the Data tab.
- A Selection variable may be specified. In this case, only the samples defined by the selection (i.e. samples where the value of the selection is equal to 1) will be considered for the calculations and graphical representations.
- You can also select an optional Weight variable if you want to take a weight into account in the calculations. For example, the sample length can be used to give less importance to the small samples, or the declustering weights in the case of oversampled areas. By default, all the values have a weight of 1.
- The numerical variable contained in the selected data table is then listed in the Grade field. This is where you select the variable on which you want to apply the border analysis.
Note: To compute the Transition probabilities plots, the Grade variable is not mandatory.
Domains definition
Use the selector to define the type of the domain variable. The domains can be provided as:
-
Grade variable cutoffs: enter a list of cutoffs which will be used as indicators to generate a set of domains. To each class will correspond a domain.
Click
 Edit to pop up the Value Definition window and customize the list of cutoffs.
-
Categorical variable: each category of the selected categorical variable will be used as a domain.
Note: It is also possible to select a (macro) selection variable. In this case, only two domains are created corresponding to the selected (named "In") and not selected (named "Out") data.
-
Macro selection variable: each index of the macro selection variable will be used as a domain.
Select the domain variable in the selector below, showing the list of available variables (filtered from the chosen type above). The domain variable must be defined on the same data table as the Grade variable of interest.
Orientation
Two types of orientation can be calculated:
- Omnidirectional: No selection is performed on the data according to any directional criterion. All the data are taken into account. By default, the orientation is set to Omnidirectional.
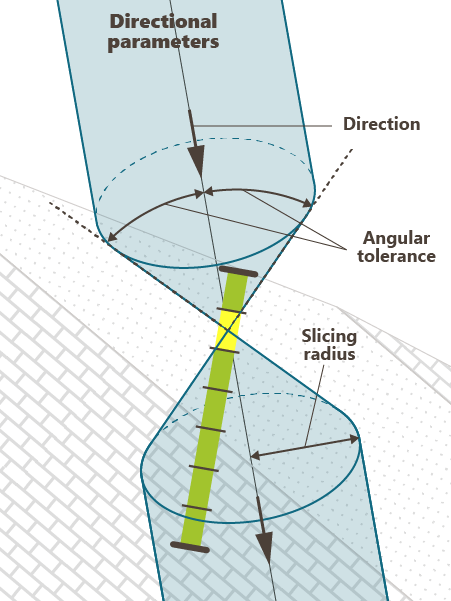
- Directional: In this case, one direction must be defined and will constrain the data taken into account. The Direction is given from an Azimuth (N0° pointing to the North) and a Plunge (90° pointing down). A vertical direction is set by default.
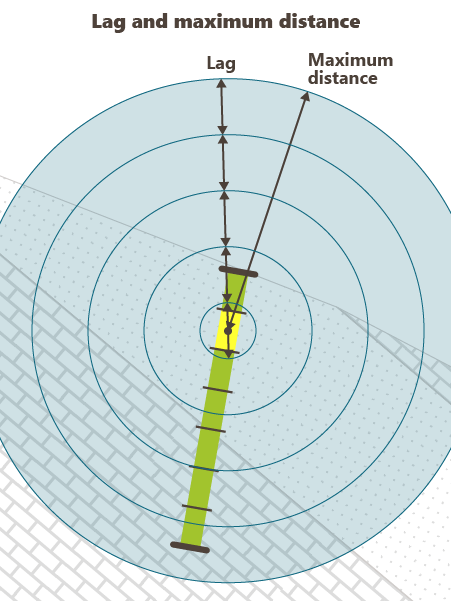
- Enter a value for the Lag. The lag defines the distance classes along the direction. Each class is centered on a multiple of the lag value. Only the data falling inside a class will be retained for the calculations. A tolerance of 50% is applied on the lag value to select all the data in the area of interest.
- Define the Maximum distance between two points beyond which no data will be retained for calculations.
When choosing a Directional orientation, two additional parameters are required:
- Enter a Tolerance on angle (in degrees, between 0 and 90°) out of which no samples will be selected. A pair of points is selected if the direction along which the two points are aligned equals the defined direction plus or minus the tolerance (in absolute value). The default value is 10°.
- The Radius represents a cylinder lined up to the reference direction, out of which the pairs of points will be selected (as for the variogram). The value you will enter in the Radius box corresponds to the radius of the cylinder.
Note: The angles used for the rotation definition are explained in the Rotations section of the online help.
Computed perspectives
Tick the perspectives that will be calculated. The default calculated perspectives are Contact analysis, Transition probabilities and Border effect.
Note: When no Grade variable is provided, only the Transition probabilities perspective can be computed.