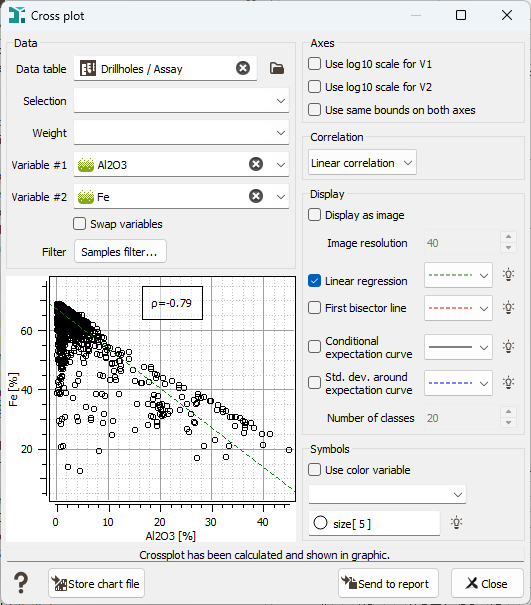
Cross Plot
The Cross plot functionality allows the display of a scatter plot between any pair of variables among the selected ones, that is the representation of two variables in a X-Y diagram. Each sample, where both variables are defined is represented by a symbol whose coordinates correspond to the values of each variable. The two variables of the pair do not play a symmetrical role. The target variable (Y, Variable #2) is displayed along the vertical axis, whereas the horizontal axis corresponds to the conditioning variable (X, Variable #1). This feature is reachable from the ribbon (in the Statistics section) or directly from a right click when selecting two numerical variables in the Data tab.
Remember that flying your mouse on a graphic window makes appear a tool bar where actions may be selected (for more information, see the documentation on Graphical Options).
The graphic can be saved in a Chart File using this particular format (using the Store Chart File button available in the task window).
Click ![]() Send to report to send the cross plot in the Reporting Window.
Send to report to send the cross plot in the Reporting Window.


