
Graphical Options
This section presents all the graphical options available in the different graphics, as well as the contextual menu of the Exploratory Data Analysis.
Contextual Menu
Highlight some points on the view and right click to pop up the following contextual menu (this contextual menu is only available in the Exploratory Data Analysis):
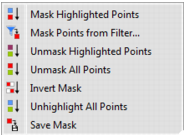
- Mask Highlighted Points: Select this option to mask the highlighted points.
-
Mask Points from Filter...: Selecting this option, a sub-panel will pop up allowing defining a filter to mask points. Select the variable to be filtered to define a first criterion.
-
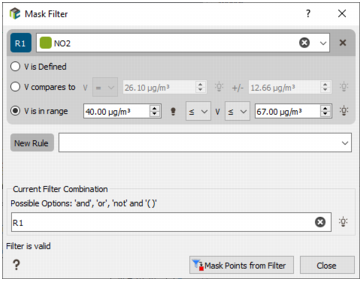
If the selected variable is a numerical variable, three criteria may be used to apply the filtering:
- V is Defined. Only the objects for which the value of the selected variable is defined are displayed.
- V compares to. The variable is compared to a value (<, ?, >, ?, =, ?) with a certain tolerance. Only the objects for which the value of the selected variable respects the equality are displayed.
-
V is in range. The variable is compared to an interval (exlusive or inclusive). Only the objects for which the value of the selected variable fits the interval are displayed.
-
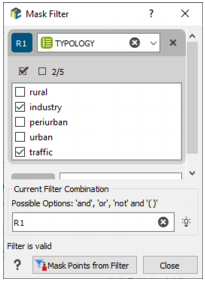
If the selected variable is a categorical variable, tick the categories that you want to mask (the unticked categories are kept).
-
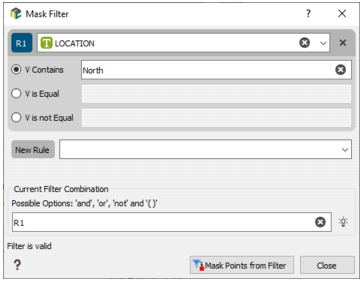
If the selected variable is a comment variable (i.e. a string of characters), three criteria may be used to apply the mask:
- V Contains. All the objects for which the selected variable contains the given string of characters are masked.
- V is Equal. All the objects for which the selected variable is identical to the given string of characters are masked. This criterion is sensitive to capital/small letters.
-
V not Equal. All the objects for which the selected variable is different from the given string of characters are masked.
-
Current Filter Combination: You can add / remove several different criteria achieved on different variables selecting a variable next to New Rule. By default the criteria are combined by a logical "and" operator but you can modified the rules. Each rule is numbered from 1 to N (the rule number is recalled in its name). The authorized operators are "and", "or", "not". Brackets can be used to create more complicated combinations.
example: S1 and not (S2 or S3)
-
- Unmask Highlighted Points: Select this option to unmask the highlighted points.
- Unmask All Points: Select this option to unmask all points.
- Invert Mask: Select this option to apply the opposite mask.
- Unhighlight All Points: Select this option to deselect all the highlighted points.
- Save Mask: Select this option to save the active samples in a selection.
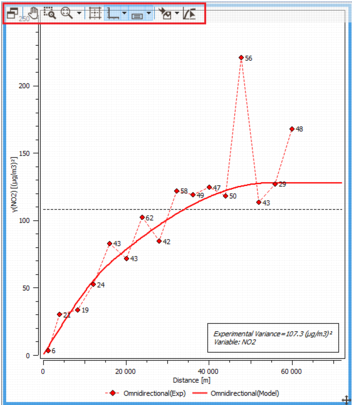
Tool Bar
Whenever the cursor overlays a graphical view, the following tool bar appears. The list of tools which appear depends on the graphic size. You can detach the graphic and/or resize the window to make appear all the complete tool bar.
-
 Click Attach/Detach view to attach / detach the graphic to / from the task.
-
 Click Selection mode to enter in the selection mode to select and highlight samples in the view.
-
 Click Append to selection (or press Shift) to add samples to the current selection. Click the samples to add them to the selection or hold down the mouse’s left button and draw a rectangle to catch the target samples.
-
 Click Remove to selection (or press Ctrl+Shift) to remove samples from the current selection.
-
 Click Polygon selection mode to select samples with a polygon. Just click on the graphic to draw polygons as you want and select the samples. Do a right click to close the polygon. This mode is only available in the Exploratory Data Analysis, Cross Validation and Estimation Validation tasks for the point graphics (i.e. for the basemaps, cross plots, probability plots, H-scatter plots but not for the histogram, box plots, swath plots).
-
 Click Append to selection (or press Shift) to add samples to the current selection with a polygon. Just click on the graphic to draw polygons as you want and select the samples.
-
 Click Remove to selection (or press Ctrl+Shift) to remove samples from the current selection by drawing a polygon in the graphic.
- Press Ctrl to toggle samples from the current selection: samples which were not selected are selected and samples which were selected are deselected.
-
 Click Editing mode to enter in the edition mode to move the graphic.
-
 Click Zoom to box to zoom on a portion of the graphic using the left mouse button to delineate the area. The mouse wheel can also be used to zoom. The zoom is applied at the pointer location.
-
 Click Zoom to home to go the view that has been previously set as the home view.
-
 Click View all to change the camera position in order to visualize all objects.
-
 Click Show/hide background grid to visualize/mask a background grid (helpful to follow the axes graduation).
-
 Click Show/hide axes to visualize/mask the axes from the graphic.
-
 Click Edit axes to access the axes edition. A dialog box will pop up in which you can modify and choose the axes names (horizontal and vertical), their bounds (minimum and maximum) and the subdivisions (spacing and values between graduations). By default the axis name is the one of the corresponding variable and show the display unit associated.
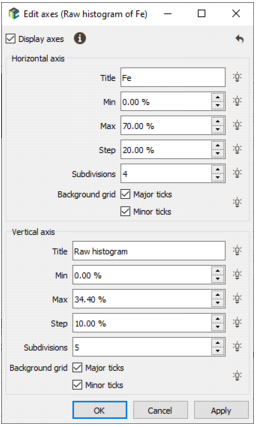
-
 Click Show/hide colormap legend to visualize/mask the used color scale as a legend.
-
 Click Edit colormap legend to choose the position as well as the background/foreground/border color of the legend.
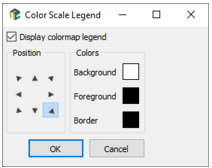
-
 Click Show/hide view label to visualize/mask the view label.
-
 Click Edit view label to change the label of the view. A dialog box will pop up in which you can write a view label and set the position of the label. By default the font, colors and alignment are defined by the Setting up Preferences. Untick the toggle to locally define other parameters and apply them to the graphic.
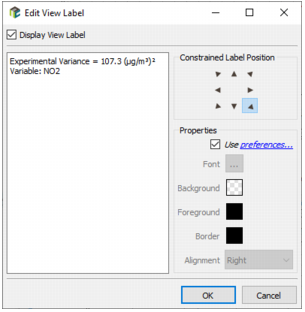
-
 Click Save as image to open an explorer and define where you want to save your graphic. By default, images are saved as *.png.
-
 Click Copy to clipboard to copy the current graphic in the clipboard. The clipboard may then easily be pasted to other applications (Word, PowerPoint, etc.).
-
 Click Send to report to send the current view to the report as a picture.
-
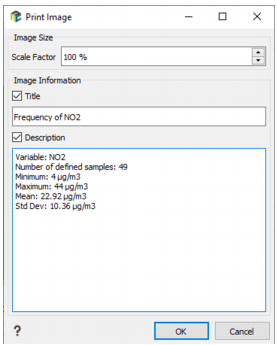
 Click Print to print the current view to a printer. An Export Image dialog box will pop up to define a title and a description.
-
 Click Interactive Fitting Mode (only available for the variograms) to interactively fit your variogram model. Each basic structure is materialized by an anchor (little squares) that you can pick and move, keeping pressed the left button of the mouse, to adjust the model on your data.
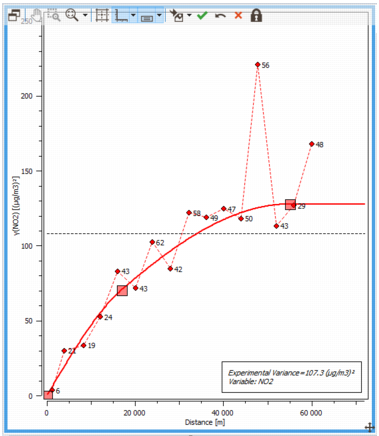
This modifies the range and the sill of the selected structure. Other modifications are available:
-
 Lock sill(s) while moving button to lock the sill of each structure on the variogram model during the model interactive fitting. The sill of each structure will be kept unchanged during the interactive fitting. To change the total sill, you will need to change the last anchor sill (and desactivate the lock). This Lock button is located on the variogram toolbar, on the top of the graph. It is only visible when being in Interactive Fitting mode and is OFF by default.
 - CTRL+pressed left click to modify the range of the selected structure keeping the global sill unchanged.
- SHIFT+pressed left click to modify the sill of the selected structure keeping the associated range unchanged.
When moving an anchor (even only horizontally), its sill and the ones of the other structures are adjusted to keep the global sill unchanged. The movement stops when you hit a zero sill (this is to prevent the anchor from moving up the variogram curve while the mouse moves horizontally to the right). So, this change the behavior of the movement with control key pressed, the height of the anchor stays fixed but this is not the same as locking the sill value:
anchor height = (nugget) + (first structure sill) + (second structure at first range)
If you shorten the range of the first structure, the term "second structure at first range" goes down, and so the sill of the first structure need to go up to keep the anchor at the same height.
After any modification, you may:
 Validate changes to accept the new model parameters
 Cancel and leave to exit the mode and reset parameters
 Undo to come back to the previously parameters.
Clicking on Interactive Fitting Mode, the Automatic Fitting on Main Variable mode (if this option is selected) is switched to Manual Fitting on Main Variable.
-
Note: In multivariate mode, the manual fitting of one variogram model impacts all the others because the defined structures as well as their respective ranges are common to all variograms.