
Swath Plot
The ![]() Swath Plot item calculates swath-plots from a defined numerical variable. This item generates a tab to one side.
Swath Plot item calculates swath-plots from a defined numerical variable. This item generates a tab to one side.
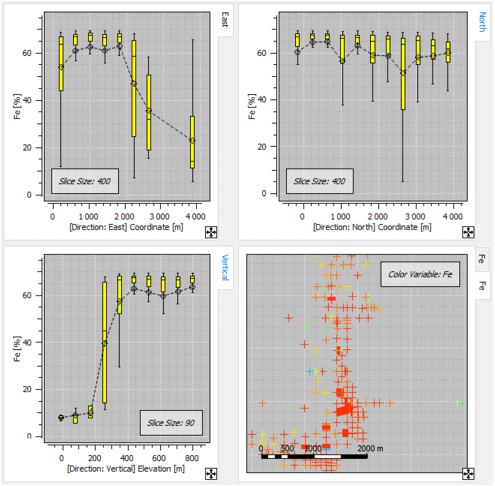
A swath-plot is a one-dimensional graph in a specific direction of interest. The space is divided into slices of a specified thickness. The average value of each slide is calculated and displayed.
This is an interesting tool to see if values vary in space.
The calculation of swath-plots requires the definition of:
- a potential Orientation. If no rotation, slices will be defined along the main axes,
- the Slices Size along U, V (and W in 3D).
By default, the display is done:
- using Boxplots,
- with Outliers,
- and the Mean of each slice is linked by a Curve.
- Click Box color to open a Color Selector and select the color used to fill the boxplots.
- Select Number of samples to display for each class (boxplot) the number of data used to compute the different statistics. It can be displayed as text or through a histogram.
- Instead of boxplots, you can also Display as trend plots. In this case, we display the Conditional Expectation Curve and the Std Dev (standard deviation) around the Expectation Curve. The conditional expectation curve plots the points representing the mean value of the target variable calculated for several ranges/classes of the conditioning variable.
The X-axis will be based by default on the coordinates (coordinates for X and Y, elevation for Z) of the points. If a rotation has been defined, you will have the length along the chosen direction.
A Display basemap option is available if a basemap or a 3D view with the same variable has been created. It adds the basemap / 3D view to the current perspective.