Experimental Variogram
This application successively considers pairs of variables measured on two different samples. In the univariate case (i.e. if you drag-and-drop one variable on the Variogram item), only one variable is considered in two different points. It enables experimental simple variograms (univariate case) or experimental cross-variograms (multivariate case, i.e. if you drag-and-drop several variables) to be plotted, that is to display the variability between the two variables versus the distance between the two samples.
Note: In the following documentation, Variogram is used as a generic word to designate the function characterizing the variability of variables versus the distance between two samples.
In addition, this procedure enables the set of pairs of variables being split into several families according to the direction in the space along which the pairs of points are aligned, and to calculate and display the variograms related to each family. These are the directional variograms.
Note: For additional information about the methodology and the different types of variograms, please refer to the technical reference Structure Identification in the Intrinsic Case.
Click on Set Anisotropy from VMap to copy the rotation defined from the VMap.
If you wish to recover the parameters used during a previous calculation, you can load them from an already stored experimental variogram (saved in a Geostatistical Set). Click Load Parameters and select the Geostatistical Set of your choice. Be careful this variogram must have been calculated on the same type of data to be consistent.
All the experimental variogram parameters (calculation mode, directions, lags, curve type...) will be reloaded, as well as the variogram cloud parameters.
Note: Old Geostatistical Sets (prior to the 2020.10 version) cannot be reloaded. They are greyed out and identified by an (Obsolete) suffix.
Calculation modes
Three types of variogram can be calculated:
-
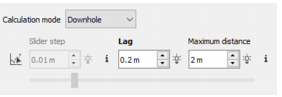
Downhole: Only the pairs of samples belonging to the same borehole are taken into account for the variogram calculation. This mode is helpful to quantify a nugget effect by analyzing the variability at 0 distance from the borehole itself.
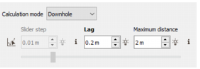
The parameters to fill are: the Lag and the Maximum distance.
-
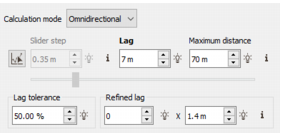
Omnidirectional. No selection is performed on the pairs of samples according to any directional criterion. All the pairs are taken into account. By default an Omnidirectional variogram is computed.
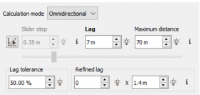
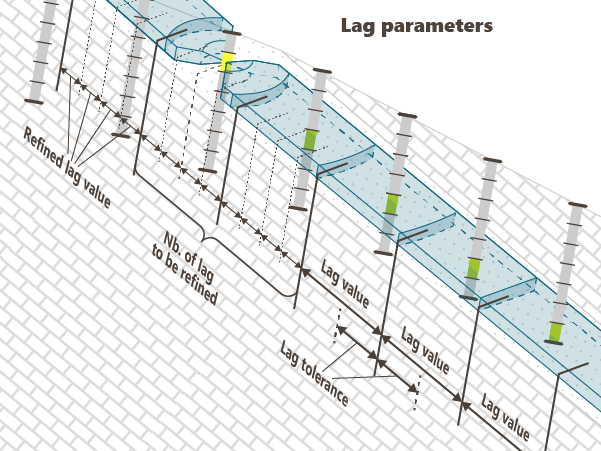
The parameters to fill are: the Lag, the Maximum distance, the Lag tolerance (in %), the Number of refined lags and the Refined lag value.
-
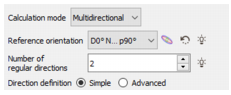
Multidirectional. In this case, several variograms corresponding to several direction families will be simultaneously plotted. Selections of samples are performed according to several regularly distributed directions in a reference plane.
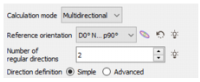
If you have selected Multidirectional, you have then to define a Reference Orientation and the Number of Regular Directions to be calculated. The regular directions are calculated anti-clockwise. Other Directions, particularly the normal (or vertical) direction, can also be calculated. The definition of the Reference Orientation can be interactively drawn using the 3D manipulator.
Note: The angles used for the rotation definition are explained in the Rotations section of the online help.
In these 3 calculation modes (omnidirectional, downhole and multidirectional), a new parameter is available: the Slider Step.
The Slider step can be activated by clicking on the ![]() button. It is activated by default when opening the task for the first time. It will pre-compute all the variograms for all multiple lags of the Slider step value up to a maximum (= Maximum distance / 2).
button. It is activated by default when opening the task for the first time. It will pre-compute all the variograms for all multiple lags of the Slider step value up to a maximum (= Maximum distance / 2).
After the computation, you can change the lag value by moving the slider: it will instantly modify the displayed experimental variogram(s) corresponding to the selected direction.
Note: It's an interactive tool: if you don't know what lag value to use for your variogram(s), this tool is very useful. However, if the slider step is activated, the Lag tolerance is set at50% and you cannot use refined lags.
Multidirectional mode
In Multidirectional mode, 2 Direction definitions are available:
-
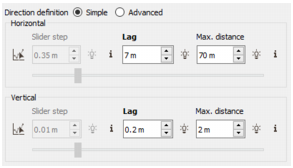
The Simple tab enables you to quickly and easily define the parameters associated to the experimental variogram. Here, only the lag value, the maximum distance and the slider step option are available. If the studied data are 3D, these parameters are defined independently for the horizontal plane (where you can also have a number of regular directions) and along the vertical.
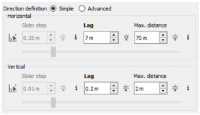
Enter a value for the lag in the Lag Value box. The lag defines the variogram classes along the distance axis (horizontal). Each class is centered on a multiple of the lag. Only the pairs of points whose inter-distance equals a multiple of this lag (plus or minus the Tolerance on Distances) will be retained for the calculations.
The size of the first lag, next to the origin of the variogram, equals lag - tolerance(lag) (half the lag value if tolerance is set to 50%).
Define the Maximum Distance between two points beyond which no pair will be retained for calculations.
The Slider step can be activated by clicking on the
 button (it is by default). After the computation, you can change the lag value by moving the slider: it will instantly modify the displayed experimental variogram(s) corresponding to the selected direction.
Note: In calculating the variogram for the first lag, a pair of points will contribute if their distance in the calculating plane is included between the values lag-tolerance(lag) and lag+tolerance(lag), where lag denotes the value of the lag and tolerance(lag) is the tolerance on the lag.
-
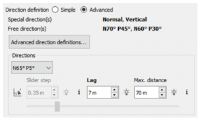
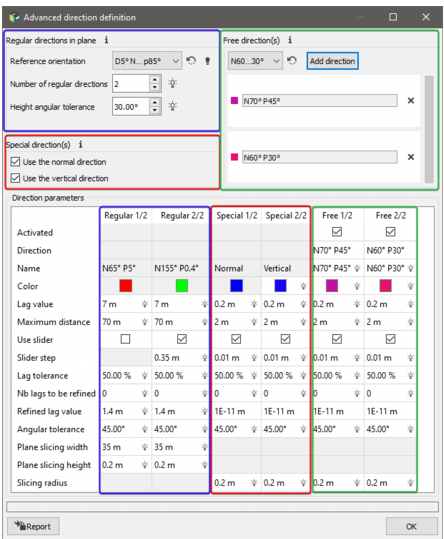
In the Advanced tab, by clicking on the Advanced Directions Definitions button, you will be able to access to more advanced parameters and tune each one of them and define all the directions you want.
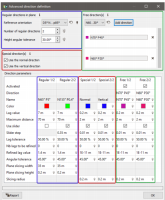
All the parameters can be defined independently, and you are not constrained anymore to have the same parameters for the plane direction for one part and for the other directions for another part. Directions are categorized following three types:
- The regular directions: they correspond to the directions defined regularly, depending on the number of directions required, in the reference plane.
- The free directions: here you can define any direction by choosing the corresponding rotation.
-
The special directions: vertical and normal. If a 3D rotation (with a dip value) is given, only the normal direction is displayed, by default.
Note: If there is no rotation of the reference plane, the normal and the vertical directions are identical.
Click on a parameter to edit and modify it. You can also select two or several directions and edit one parameter to simultaneously change the corresponding one of each selected direction.
-
You can Activate or not several directions: the activated directions will be drawn in the graphics and the other ones will not.
Note: All the experimental variograms in all the directions are computed and used for the variogram fitting step (even when not activated). This feature is mainly used to compare variograms on a direction-by-direction basis without having to recompute for each change of direction.
- You can enter different Lag value and Maximum distance for each directions. To help you differentiate them, you can choose their Color.
- You can also check the Use Slider parameter, which allows you to set a value in the Slider step parameter for each directions. It will pre-compute all the variograms for all multiple lags of the Slider step value up to a maximum (= Maximum distance / 2).
-
The default Lag tolerance is 50%. If you want to take into account less pairs in you variogram, you can set a lower value.

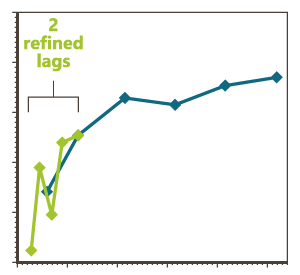
- If you wish to better assess the variability at small scale, you may reduce the lag value at small distances, that is to say, subdivide the first lags in smaller lags. In the Number of Lags to be Refined box, enter zero or a positive integer. The lags will refined from the rank 1 up to this specific rank. Note the half lag between 1 and lag/2 corresponds to the rank 1.
-
Enter the value of a lag subdivision (in length unit) in the Refined lag value box.

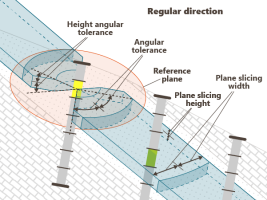
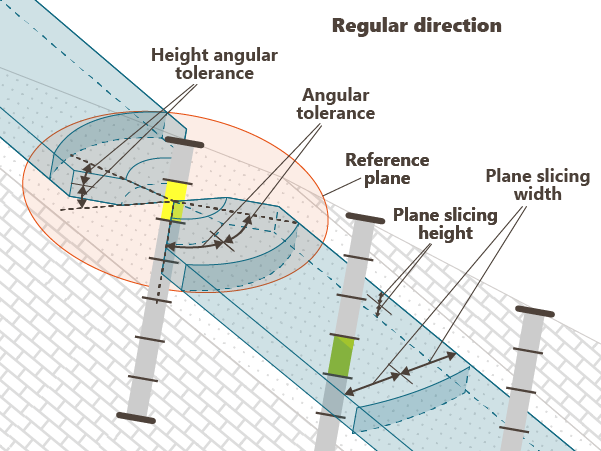
- Enter a tolerance on angle (in degrees) out of which no pair of points will be selected in the Angular Tolerance box. A pair of points is selected if the direction along which the two points are aligned equals one of the regular directions plus or minus the tolerance (in absolute value).
- The Slicing Width represents a strip along the direction contained in the reference plane and orthogonal to the variogram direction out of which the pairs of points will be selected. The value you will enter in the Slicing Width box corresponds to the half width of this strip.
-
The Slicing Height represents a strip along the direction orthogonal to the reference plane out of which no pair of points will be selected. This has no action in 2D. The value you will enter in the Slicing Height box corresponds to the half height of this strip.
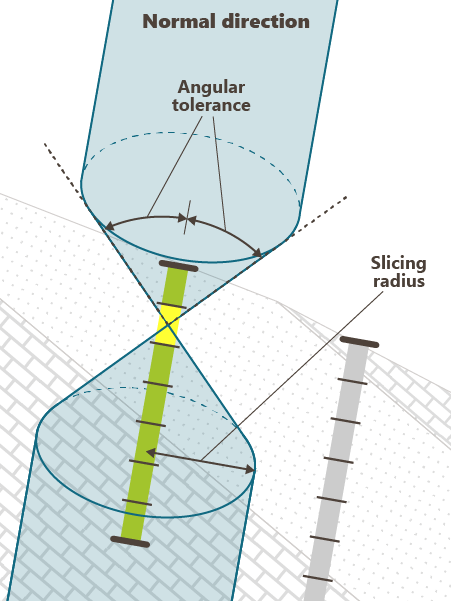
-
The Slicing Radius represents a cylinder lined up to the direction of the variogram out of which the pairs of points will be selected. The value you will enter in the Slicing Radius box corresponds to the radius of the cylinder.
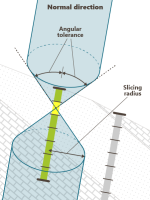
Note: The width / height slice parameters are not used for the normal/vertical direction variogram (nor for irregular/free directions) because it is not defined within a plane, as for the other directions which are defined in the reference plane. You need to play with the tolerance parameter to restrict the search. Therefore, the shape of the search in the normal/vertical direction is simply a cone.
When closing the Advanced Directions Definition panel, a summary of the computed directions is displayed.
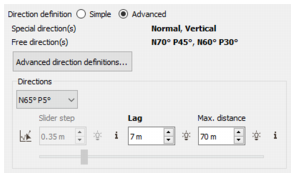
As in the other 2 modes (omnidirectional and downhole), you have access to the Lag value, the Maximum distance and the Slider step for each direction (or group of directions for the regular ones). Those parameters can be directly modified here to recompute the experimental variogram(s).
Others options
-
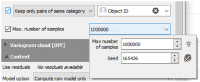
The option Keep only pairs of same category (respectively Reject pairs of same category) requires to select a numerical or categorical variable. Reading this variable, the variogram calculation will take into account only the pairs of points which belong to the same value or category (resp. which do not belong to the same category). For example, if you select the Object ID ticking the Keep only pairs of same category option, it will compute the intra-line variability (i.e. it takes into account the pairs of points of a same borehole). Choosing Reject pairs of same category, it will compute the inter-line variability (i.e. it takes into account the pairs of points of different boreholes).
Note: The option "Keep only pairs of same category" is not available in Downhole mode.
-
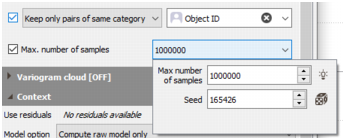
The option Max. number of samples is a decimation feature to deal with big datasets. When checking this option, the experimental variogram is calculated on a subset of the input data defined by a random selection of the input samples. Parameters required to generate this selection are:
- The Maximum number of samples to be kept, to define the number of samples to consider for the variogram calculation (i.e. kept by the selection).
-
A Seed, for results reproducibility. There is no genuine rule for setting a seed. Nevertheless, a common practice is to define the seed as a large value (avoid 1 or 2 digit numbers). If you wish to perform a variogram calculation producing different results, simply specify a different value for the seed. Conversely, choosing the same seed and the same number of samples to consider (keeping the environment unchanged) will produce identical results.