
Export CSV/Excel
The Export functionality enables you to export data (points or boreholes) or results on a grid to an ASCII file (in a *.csv, *.xls or *.xlsx file).
Input
The first section of the Input part depends on the type of data we export:
-
Points:
- Click the directory icon to open a Data Selector and select the Input File containing the variables you want to export. The data table can also be dragged and dropped directly from the Data tab.
- You can define an optional Selection variable to filter samples which will be exported.
- Any data table can be exported as points. For example, you can decide to export your file as boreholes/wells but you can also choose to export them as 3D points by choosing the Points Export task.
-
Boreholes: Two modes are available:
- If you choose the Input Boreholes mode, all the associated tables (tops, trajectories, deviations and all assays) will be exported at the same time in separated files (respectively named XXX_Tops.csv, XXX_Trajectories.csv, XXX_Deviations.csv and XXX_AssaysName.csv) when exporting to CSV, or as several sheets when exporting to an Excel file.
- Click the directory icon to open a Data Selector and select the Input Boreholes you want to export. The boreholes file can also be dragged and dropped directly from the Data tab. All the data tables associated to the selected boreholes will appear in the Variables area. For each of these data tables, you could select the variables to be exported.
- You can define an optional Selection variable (contained in the tops data table) to filter boreholes which will be exported.
- If you choose the Input Data Table mode, only one data table contained in a boreholes file will be exported.
- Click the directory icon to open a Data Selector and select the Input Data Table you want to export. The data table can also be dragged and dropped directly from the Data tab.
- You can define an optional Selection variable (contained in the same data table) to filter samples which will be exported.
-
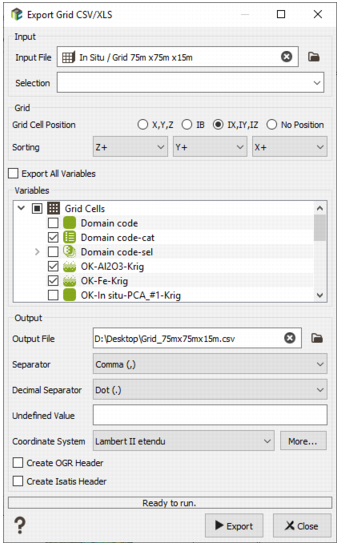
Grid:
- Click the directory icon to open a Data Selector and select the input grid containing the variables you want to export. The data table can also be dragged and dropped directly from the Data tab.
- You can define an optional Selection variable to filter samples which will be exported.
-
Grid Cell Position: Choose the implicit variables automatically added to the list of variables to be exported. If a selection is active, only selected samples will be exported.
- X, Y, Z: Coordinates are automatically added to the list of variables to be exported.
- IB: Cell index is automatically added to the list of variables to be exported.
- IX, IY, IZ: Cell indices are automatically added to the list of variables to be exported.
- No Position: Only selected variables are exported. Be careful if a selection is applied on input, you will have no reference to identify your grid cells.
- Sorting: It is used to define in which order the grid nodes will be written in the output file using the appropriate sorting mode (from the fastest to the slowest). It is not available if you choose to add the X, Y, Z coordinates.
- For example: +Z +Y +X means that the second node will be: ix=1, iy=1,iz=2. A + sign means nodes are exported from the nearest of the grid origin to the furthest. A - sign means nodes are exported from the furthest of the origin to the nearest. For instance, -Z +Y +X will export from top to bottom. A sorting different from +Z +Y +X will increase the export time.
- By default the toggle Export All Variables is activated. All the variables contained in the selected file will be exported. If you want to export only a part of the variables, untick the toggle to access the Variables list and select the variables you want to export. Any kind of variable can be exported from Isatis.neo: numerical, selection, categorical, macro variables. Variables will be exported using the unit and display format.
Note: The implicit variables (sample number, coordinates, ...) do not appear in the Variables list but they are automatically exported, except for the grids where you choose a Grid Cell Position defining the added variables.
Output
- Select the Output File in which you want to save the exported data. Click the folder to pop up a window file selector. Data can be exported as a CSV file or as an Excel file (.xls or .xlsx).
- Enter the alphanumerical value that will be used to report an undefined sample. By default, the field is empty.
- Select a Separator (only available if the output file is a CSV file). To specify the CSV symbol that will be used to separate the fields. By default, a comma is set.
- Select a Decimal Separator (only available if the output file is a CSV file). To specify the CSV symbol that will be used to represent the decimal point. The default value is a dot.
- Select a Coordinate System. You cannot select any coordinate system if the coordinate system of the project is a local coordinate system. By default the coordinate system selected is the one of the project. If the coordinate system you are looking for is not in the list, click More to pop up the Coordinate System Selector.
- Tick the Create OGR Header option to save a description header (.vrt) that will make the file directly readable by QGIS. Whatever the exported file, it will be read by QGIS as a points file. This option will not be available if the exported file corresponds to boreholes or a grid file.
- Tick the Create Isatis Header option to save a description header that will make the file directly readable by the Isatis import ascii module. It can also be kept only for information. The header will be saved in a separated file (with the same name as the defined output file but with a .hd extension). This option will not be available if the exported file corresponds to boreholes.
- Click Export to export the data. If the output file already exists, a confirmation message will be popped up.
- Click Close to close the window.