
Grade Post-processing
Grade Post-processing is designed to downscale the resolution of your block model. This tool calculates local grade tonnage curves on a panel grid (variables for the quantity of metal Q, tonnage T, and mean grade above cutoff M) from estimated or simulated grade variables on a block model.
You can choose how to deal with undefined blocks and specify a set of cutoffs for which the grade tonnage curves will be derived. The application also handles multivariable cases with cutoff(s) applied on the main variable.
Proportions are considered using discretization points, when the two grids do not match, for more accurate quantities.
In addition, this application allows you to create the ouput grid if the input is a regular grid or sub-block model.
Input
- Click the folder icon to pop up a Data Selector and select the Refined data table which contains the estimated / simulated grades. It can be a 2D or 3D grid. The data table can also be defined by a simple and quick drag-and-drop from the Data tab.
- A Selection variable may be specified. In this case, only the samples defined by the selection (i.e. samples where the value of the selection is equal to 1) will be considered for the calculations. This selection can also be defined by a categorical variable.
- You can also select a Weight variable if you want to take a weight into account in the calculations. Be careful, there is only one weight variable, which applies to all the defined variables. Blocks associated with a negative or zero weight or undefined will be skipped.
- Select at least the Main variable. It can be a simple numerical variable for a kriging for example, or a macro variable in case of simulations. If needed select one or several Secondary variables. As for the main variable, you can also define a macro variable but it should have the same indices as the main macro variable. The variables must be consistent (all simple variables or all macro variables).
Parameters
-
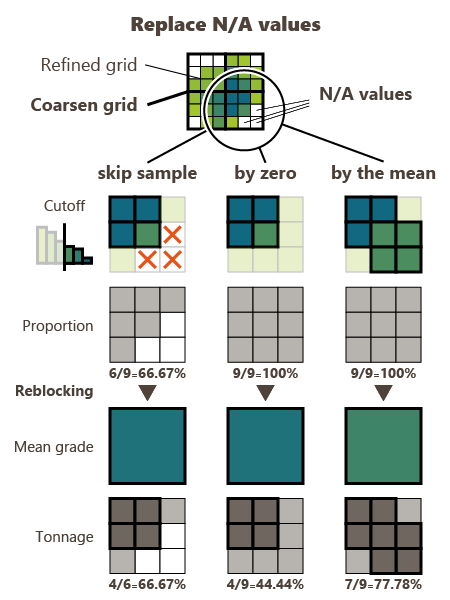
If for some reasons, some blocks are not informed (the estimation / simulation returned N/A), these blocks can be skipped (default option) or they can be patched with a grade equal to zero or patched with the mean of the block.
-
Setup the Main variable cutoffs. Click
 Edit to pop up the Value Definition window and customize the list of cutoffs.
Output
-
If the Create new grid file option is not activated, the Q/T/M variables will be stored on an existing grid. Click the folder icon to pop up a Data Selector and select the Coarsen data table. It should be a 2D / 3D grid. You may define a Selection on the output blocks - useful when several steps should be processed one after the other, to manage different domains particularly.
If the Create new grid file option is activated, the output grid is generated on-the-fly to cover the input refined data table. In this case, it is possible to define the Grid geometry by setting a Number of cells to be merged along U, V and W (2x2x2 by default). The origin, the number of cells and rotation are indicated for information. The option is only available if a regular grid or regular sub-blocks have been defined on input.
- The objective of the Pattern (and Context) parameter is to help the definition of output results names. You can edit this pattern and define the name of your choice. Click on “bulb” to retrieve the default pattern: %context-%var-%qtm-%label
- The Label column is editable by a double-click for modification. The Preview enables you to see the final name associated to each output result.
-
You may then specify several output variables:
-
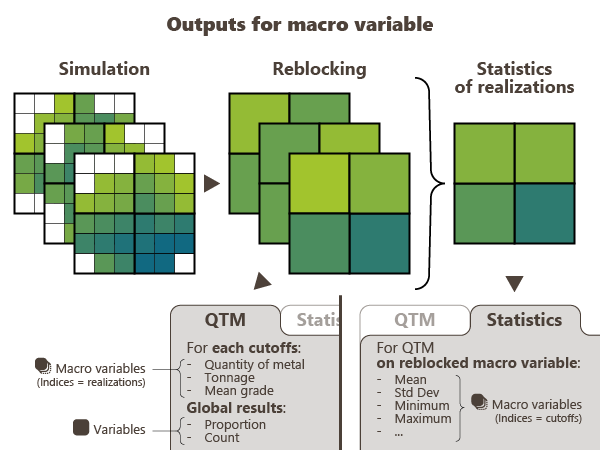
The QTM tab computes the Q, T, M for each cutoff, over all realizations and stores all these Q, T, M. The output is a macro variable for each grade variable defined on input (main and secondary variables) and for each cutoff. Each output variable has one index for each realization.
The Coarsen mean, Proportions and Count variables are simple variables. They are of particular interest to be stored in case of non-matching grids.
The Coarsen mean variable represents the mean value of the refined cells inside each coarsen cell.
The Proportions variable represents the proportion of refined cells inside each coarsen cell (between 0 and 100%).
The Count variable represents the number of refined cells inside each coarsen cell.
-
The Statistics tab is only available if the Main variable is a macro variable. It computes the Q, T, M for each realization, one by one, and stores only the different statistics of these Q, T, M. The output is a macro variable for each grade variable defined on input (main and secondary variables). Each output variable has one index for each cutoff.
Tick the statistics you want to compute: Mean, Standard deviation, Variance, Minimum, Maximum and/or Quantiles. Click
Edit to pop up the Value Definition window and customize the list of quantiles.
-
-
As the cutoff results are saved in macro variables, these ones can be overwritten if they already exist by checking the Overwrite macro-variables option. Otherwise, results will be appended (i.e. new indices will be added in the existing macro variable).
- Select the Display scene toggle to display the result of Q variable (if calculated, or T, or M) for the first cutoff in a defined scene (2D or 3D) at the end of the run.