
Histogram
The Histogram functionality allows to calculate and display a bar histogram for each selected variable. The variable range is divided into iso-width classes. To each class is associated a bar whose extension (along the vertical axis) is directly proportional to the frequency of the class, that is the percentage of samples whose value belongs to the class (see example below). This feature is reachable from the ribbon (in the Statistics section) or directly from a right click on a variable in the Data tab.
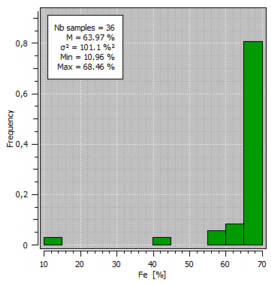
Classical statistics are displayed in the graphic window: number of samples, mean value, variance, minimum and maximum.
Remember that flying your mouse on a graphic window makes appear a tool bar where actions may be selected (for more information, see the documentation on Graphical Options).
The graphic can be saved in a Chart File using this particular format (using the Store Chart File button available in the task window).