
Import Boreholes (CSV/XLS)
This interface is designed to load deviated boreholes data coming from file(s) (the information can be contained in separate files or in a unique file) in CSV/XLS format.
This application simultaneously merges borehole information issued from different files - a TOPS file (containing top information, i.e. borehole name, top coordinates, ...), an CORE SAMPLES file (generally containing grade information defined between two depths) and additional information (such as geology, lithology) - while integrating a borehole deviation survey (DEVIATIONS file) - if it exists. Information can also be provided at a dedicated depth (not between two depths) through a LOG file (continuous information) or a MARKER file (punctual information).
The principle is, for each borehole, to rebuild samples as small as possible which share the same information in all the files to be merged.
Note that the program can only read data gathered along 3D lines.
The loading procedure is divided into 5 steps:
- Mode
- Input ASCII/XLS File
- File Decoding
- Variables Definition
- Summary
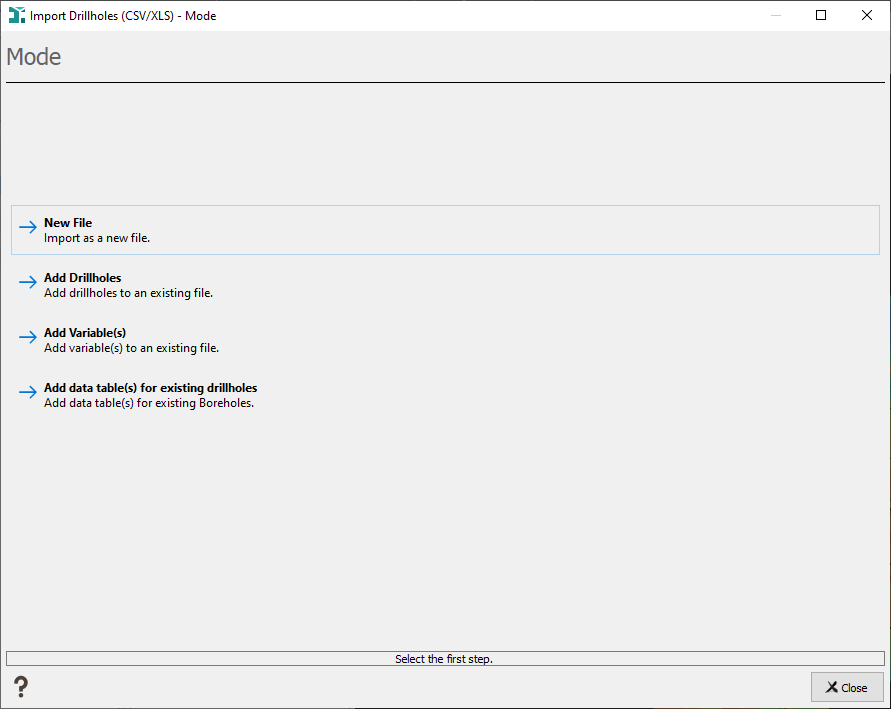
Modes
Four import modes are available:
- New File: to import data in a new file. If the file already exists, a confirmation to overwrite will be asked running the import.
- Add Boreholes: to add additional boreholes to an existing file. An additional step will be added to ask in which existing file you want to add samples.
- Add Variable(s): to add new variables to an existing file. Merge data by adding some new variables to an already existing Isatis.neo data table. An additional step will be added to ask in which existing file you want to add variable(s). The principle is that the organization of this appended data is identical to the one of the initial data file (in other words, the samples are the same). You should pay attention to the order of the samples stored in the file. If a variable already exists in the first set, it will be replaced by the new values of the second set. This mode enables you to enter datasets containing a large number of variables which would not fit in one single file (remember that all the variables corresponding to one sample must be present on one single record of the input file).
- Add data table(s) for existing boreholes: to append new data tables (core samples, logs or markers) to existing boreholes (tops). In the first step defining the different input data tables, an additional parameter asks in which existing file you want to add the data table(s).
New File Mode
Two import modes are available depending on the format of the input files.
- Distinct Tops, Deviations and Core Samples Files: This mode should be used when the data to import are stored in several input files such as tops (= collar), deviations (= survey) and core samples (= assays) files.
- One Core Samples File Only: This mode should be used when the data to import are stored in a unique input file. The unique file contains the top (HoleID and XYZ coordiantes of the top), possible deviation with XYZ coordinates along the boreholes, and the core sample information (From and To, plus the variables of interest).
Note: The "One Core Samples File Only" mode could be used when you have vertical boreholes or sufficient XYZ coordinates to build accurate trajectories (it could be good to have already done the compositing in another software for example).
Distinct Tops, Deviations and Core Samples Files Mode
Input File
This step allows you to select the different files. If the (grade) information is contained in an Excel file, the selected input file can be the same, but the information related to each support (tops, deviations, core samples) should be stored in different sheets.
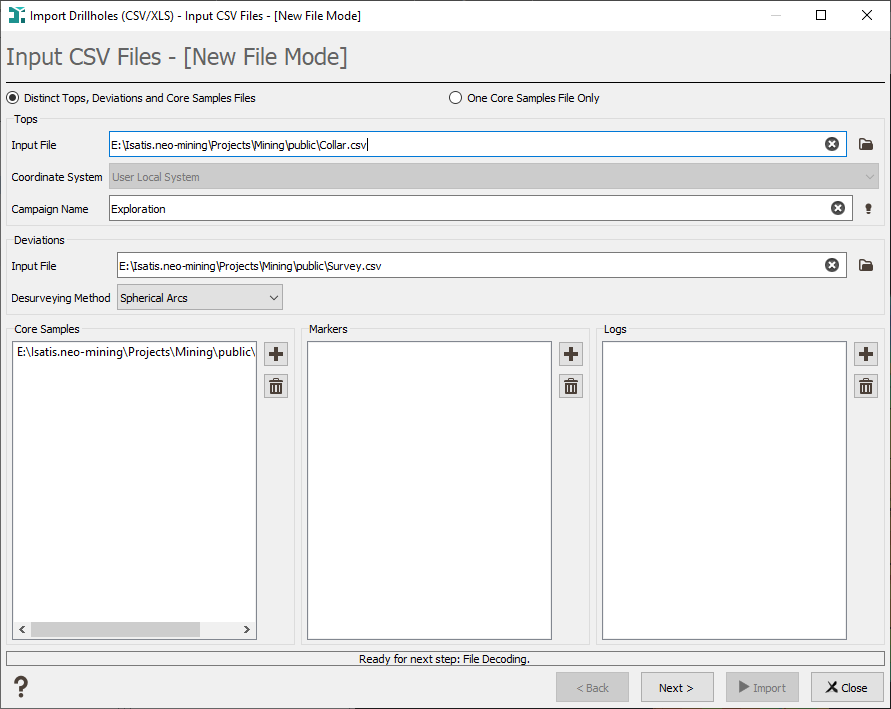
A coordinate system of the input boreholes (only if the project coordinate system is not local) and a campaign name can also be defined.
- Campaign Name: Enter the name of the campaign. All the boreholes that will be imported from this file will be attached to this campaign name.
- Coordinates System: Select in the list the correct projection system. The most common projection systems are preselected. If the projection you are looking for is not in this list, click More to open the Coordinate System Selector window.
-
Desurveying Method: Select the method that will be used to build the boreholes trajectories. The default method is the Spherical Arcs algorithm.
To obtain detailed information about the different implemented algorithms, you can consult the Technical References: Desurveying Methods.
Note: If no Deviations file is provided, boreholes are considered as being vertical.
If you have chosen the Add data table(s) for existing boreholes mode, there is no Tops and Deviations to be selected, only Core Samples, Markers and/or Logs data table(s). The Campaign Name, Coordinate System and Desurveying Method are not required (as they have already been defined by the previous import). But you have to define the Output boreholes file in which the new data table(s) will be added.

File Decoding
This step depends on your file format (CSV or Excel).
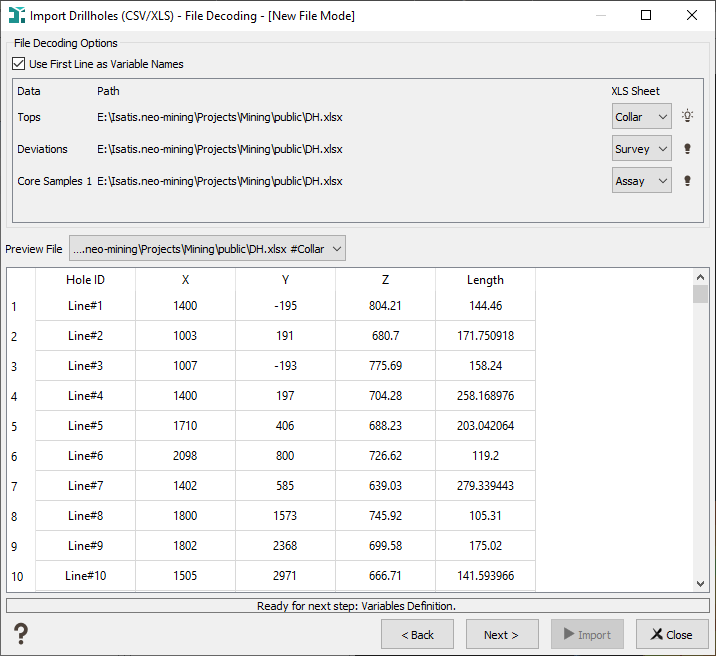
Excel File
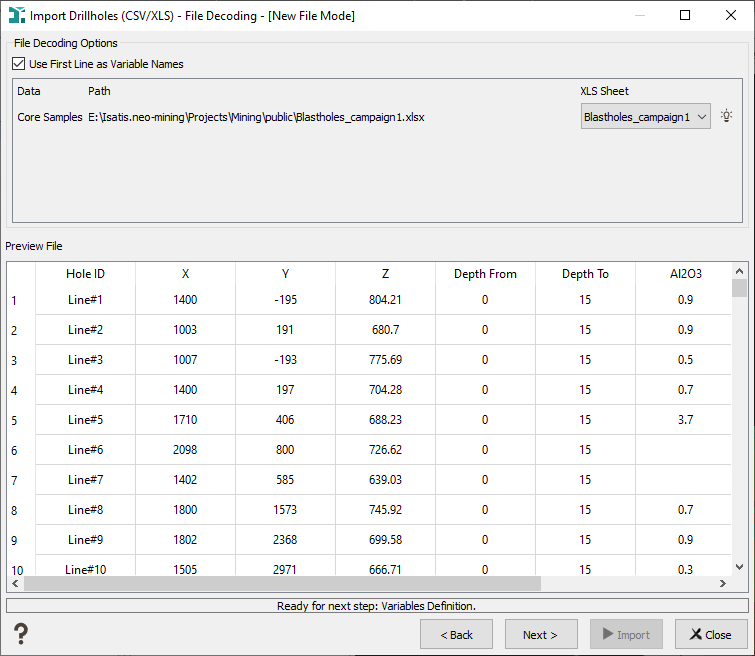
This page enables you to verify your file is correctly read and to define for the Tops, Deviations, Core Samples, Markers and Logs the corresponding Excel sheets.
- Use First Line as Variable Names: tick this option to specify that the first line of your Excel spreadsheet contains the name of the different fields.
- Your Excel file may contain several data spreadsheets. Use the XLS Sheet selector to specify from which sheet the Tops, Deviations, Core Samples, Markers and Logs data will be read.
The preview zone shows you the first lines of the file selected by the Preview file toggle to help you choosing your options.
Note: If you have several Core Samples, Markers or Logs in the same Excel file, you need to load the Excel File as many times as you have different sheets.
CSV Files
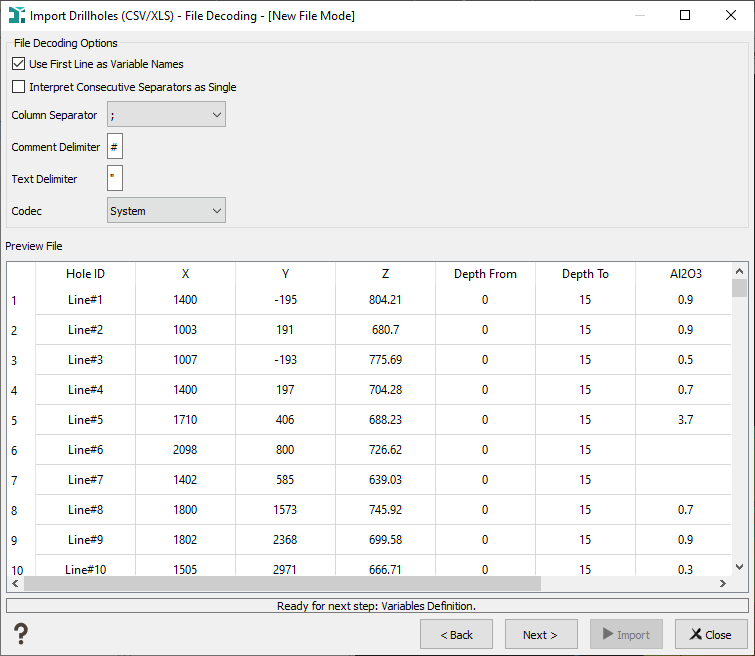
This page allows you to define the way the CSV files are organized. The parameters defining the organization of the files are:
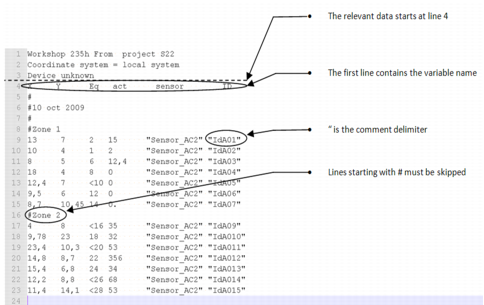
- Column Separator: Define the given character that separates the columns (, ; / #...).
- Column Delimiter: Some ASCII files contain comment lines that must be ignored. These lines usually begin with a specific character (/, # for example). Enter the corresponding character, all the lines beginning with this character will be skipped.
- Text Delimiter: If the data have some alphanumerical variables, they are usually delimited by characters such as « or ’’. Enter here this specific character.
- Use the First line as Variable Names: Select this option if the first line of the file contains the names of the variables.
- Interpret Consecutive Separators as Single: If you do not select this option, two consecutive separators (that is say the character you define just above) will be interpreted as a missing value.
- Codec: The option is reserved for advanced users. Select here the codec in which the ASCII file is coded. The default codec System works in most of the cases.
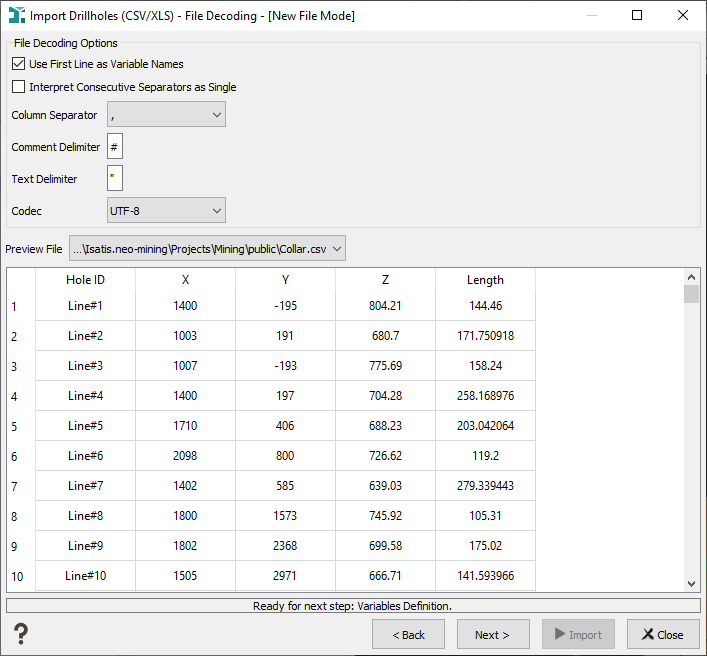
The preview zone shows you the first lines of the file to help you choosing your options. You can select which one of the Tops, Deviations, Core Samples, Markers or Logs files you are displaying.
Variables Definition
The fourth panel enables you to define the variable properties.
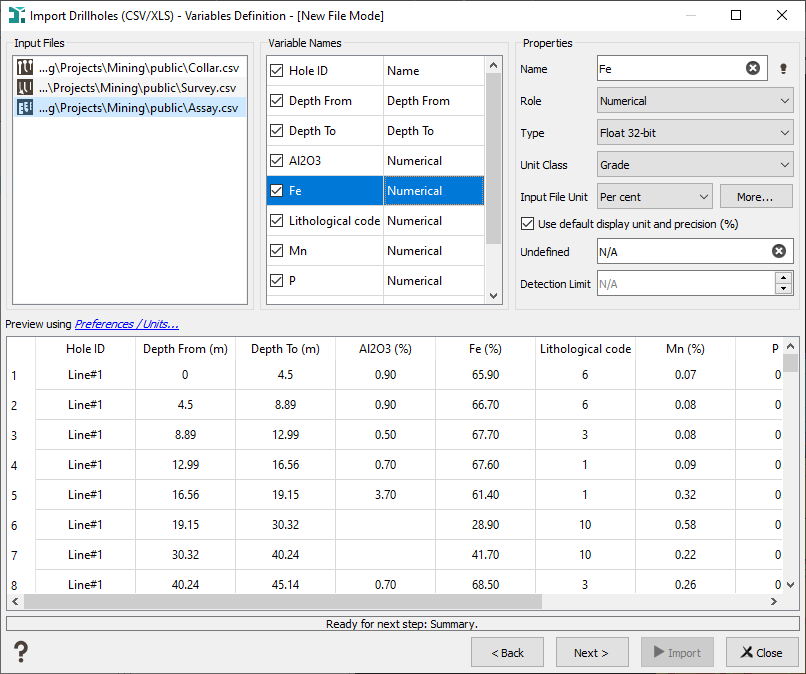
Click a variable in the Variables Names list and edit the Properties:
- Variable: If you have selected the append mode, select here the corresponding variable, otherwise this list is disabled.
- Name: Enter here the name of the variable, if you have selected on the second panel the option Use First Line as Variable Name, the name of the variable will automatically appear in the preview table.
-
Role: For each input file/sheet, you have to define in a list the role of the variables. This list depends on the selected input file:
-
Tops file:
- Borehole Name: this variable is mandatory.
- Coordinates: this is the X, Y or Z coordinate of the borehole tops. Each coordinate value must be defined. Otherwise an error message will occur.
- Length: this variable is optional. It describes the borehole length. If it is not provided, the length is automatically calculated taking into account the samples definition.
- Numerical variable: numerical variables can be float or integer variables and are stored in 32 or 64 bits. Storage format for float variables is a question of variable precision. A 64 bits format guarantee a better precision but it will take more place on the machine. In Isatis.neo, coordinates are stored in 64 bits. For the integer variables, it depends on the variable values. An integer 32 bits allows the storage of values until 231, and until 263 with an integer 64 bits.
- Categorical variable: this kind of variable is made to deal with categories (with a maximum of 32767 categories). A category is associated to a specific string of characters (corresponding to an integer value) and to a dedicated color. The different categories of the variables are managed via a catalog. Categories are exclusive and they can not overlap themselves or a category can not contain two others for example.
- Text: text variables may be loaded in Isatis.neo. They are mainly used for selections and displays.
- Selection: a selection variable corresponds to a binary variable which can take the value 0 or 1 (equal 1 when the data point is inside the selection, 0 otherwise). A sample will be selected if the value of the selection variable is set to 1 and masked off if the value is 0. No undefined value is allowed in a selection variable. Many operators of Isatis.neo use a selection during input/read data table or output/write data table. In the input phase, this means that some samples will not be used during the calculation. In the output phase, this means that you do not want the operator to be applied to the masked samples.
-
Deviations file:
- Borehole Name: this variable is mandatory.
- Depth
- Azimuth: If no Azimuth variable is defined, it will automatically be set to 0.
- Dip: If no Dip variable is defined, it will automatically be set to -90 (vertical borehole oriented downward).
-
Core Samples file:
- Borehole Name: this variable is mandatory.
- Depth From / Depth To: these two variables describe the minimum and maximum depths analyzed.
- Numerical
- Categorical
- Text
- Selection
- Markers / Logs file: the variables are the same as for the Core Samples file but the information is defined following a depth (and not a from/to).
-
- Unit Class: Enter here the unit class of the variable.
- Input File Unit: Select here the unit of the variable. If the Unit that you want to use is not proposed in the list, you can define your own unit by clicking on the More button.
- Tick the Use default display unit and precision option to define the Input File Unit as the unit used each time you will do something on this variable in Isatis.neo (display, statistics...). Otherwise the unit defined in the Preferences for the associated unit class and its associated precision will be used.
- Undefined: Usually undefined values are marked with a specific string in the file such as -99999, N/A or Undef. Enter here the correct undefined value.
-
Detection Limit: Enter here a value that you want to consider as the detection limit. A DL is unique to each variable. All the values that are smaller than this detection limit will be replaced by the value of the detection limit.
An alternative to the global detection limit definition is to define directly in the input assay file values under the detection limit. Values that are below the detection limit need to be imported preceded by a ’<’symbol followed by the detection limit value (<2% with DL=2%).These values will be replaced by the value of the detection limit during the import.
In both case, a DL(VariableName) column is created in the preview table. If the DL value equals 0, it means that for the associated variable, the sample value is above the detection limit. If the DL value equals 1, it means that for the associated variable, the sample value is below the detection limit.
The Preview Using Display Unit Preferences area shows you the first lines of the file to help you choosing the properties of the variables. Click Unit Preferences to modify the Display Unit of the different variables.
The Preview zone shows you the first lines of the file to help you choosing the properties of the variables.
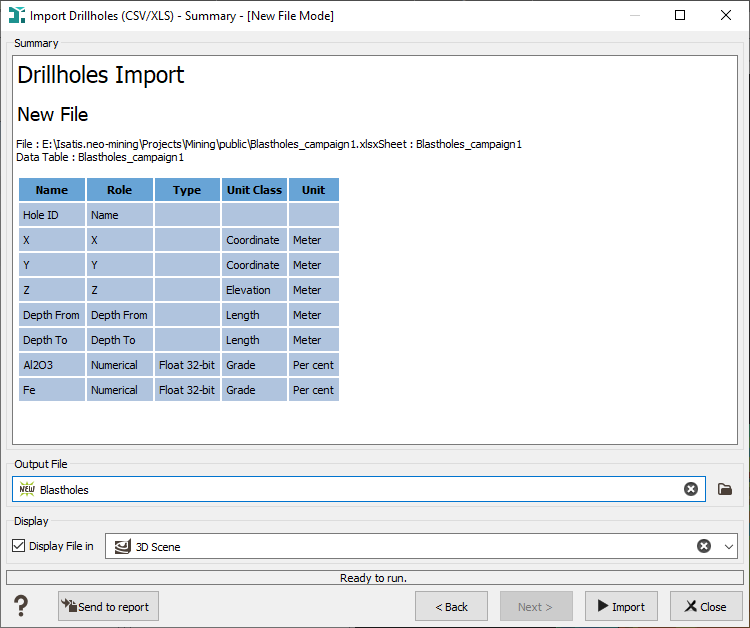
Summary
This last page sums up the variables definition.
Select the Display toggle to display the imported data in a defined scene at the end of the run.
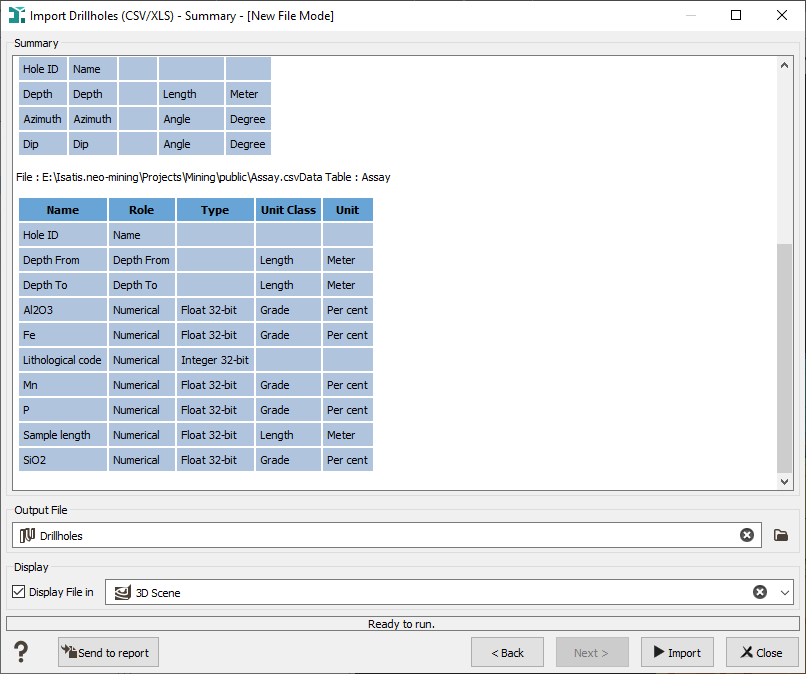
Once you have defined all the parameter click Import to end the task.
One Core Samples File Only Mode
Input File
Select the unique input file containing the tops, possible deviations, and core samples information.
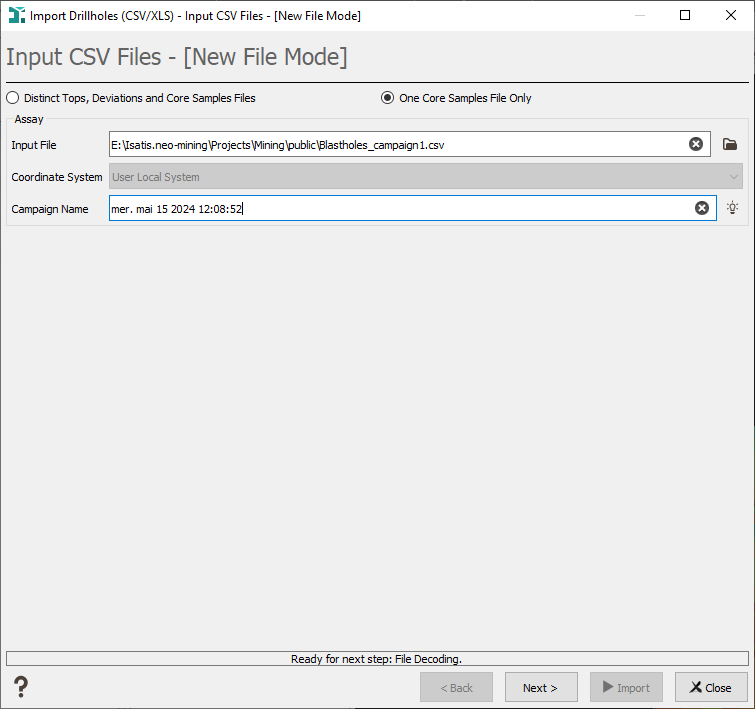
A coordinate system of the input boreholes (only if the project coordinate system is not local) and a campaign name can also be defined.
- Campaign Name: Enter the name of the campaign. All the boreholes that will be imported from this file will be attached to this campaign name.
- Coordinates System: Select in the list the correct projection system. The most common projection systems are preselected. If the projection you are looking for is not in this list, click More to open the Coordinate System Selector window.
File Decoding
This step depends on your file format (CSV or Excel).
Excel File
This page enables you to verify your file is correctly read and to define the Excel sheet you want to consider.
- Use First Line as Variable Names: tick this option to specify that the first line of your Excel spreadsheet contains the name of the different fields.
- Your Excel file may contain several data spreadsheets. Use the XLS Sheet selector to specify from which sheet the data will be read.
The preview zone shows you the first lines of the file selected by the Preview file toggle to help you choosing your options.
CSV Files
This page allows you to define the way the CSV file is organized. The parameters defining the organization of the file are:
- Column Separator: Define the given character that separates the columns (, ; / #...).
- Column Delimiter: Some ASCII files contain comment lines that must be ignored. These lines usually begin with a specific character (/, # for example). Enter the corresponding character, all the lines beginning with this character will be skipped.
- Text Delimiter: If the data have some alphanumerical variables, they are usually delimited by characters such as « or ’’. Enter here this specific character.
- Use the First line as Variable Names: Select this option if the first line of the file contains the names of the variables.
- Interpret Consecutive Separators as Single: If you do not select this option, two consecutive separators (that is say the character you define just above) will be interpreted as a missing value.
- Codec: The option is reserved for advanced users. Select here the codec in which the ASCII file is coded. The default codec System works in most of the cases.

The preview zone shows you the first lines of the file to help you choosing your options.
Variables Definition
The fourth panel enables you to define the variable properties.
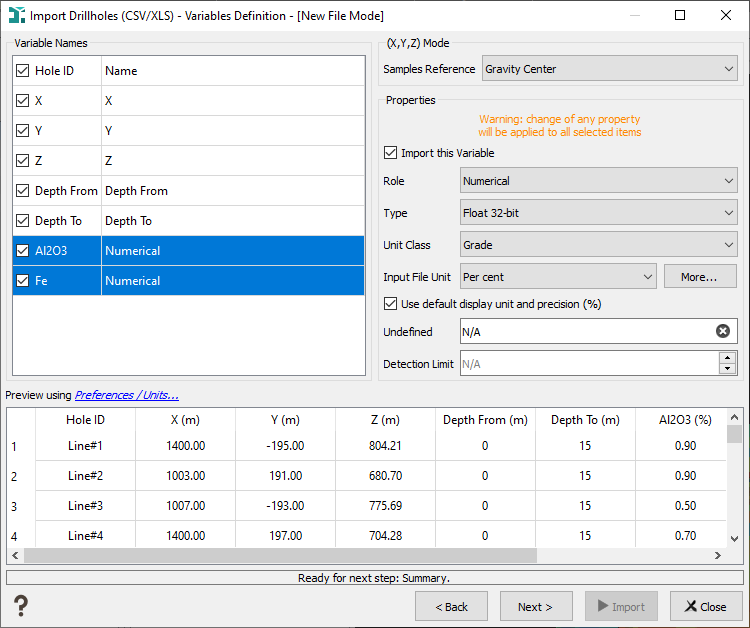
(X, Y, Z) Mode: In the One Core Samples File Only mode, each sample is referenced by a unique point coordinates, a Depth From and a Depth To information. To be able to localize accurately in 3D each sample, the (X, Y, Z) Mode parameter is added. Two options are available:
-
Top: The X, Y, Z coordinates of each sample in the input file correspond to the location of its top.
One extrapolated point need to be added, corresponding to the "Depth To" for the last sample, at a distance (Depth To - Depth From) from the last sample top
-
Gravity Center: The X, Y, Z coordinates of each sample in the input file correspond to the location of its gravity center.
Two further points need to be added to the trajectory:
- one at the "Depth From" of the first sample at a distance of (Depth To - Depth From)/2 from the first data point ;
-
one at the "Depth To" of the last sample at a distance of (Depth To - Depth From)/2 from the last data point.
Note: The two options will build trajectories made up of linear segments. You may have sharp angles between a sample and the following one if the hole trajectory is not close to a straight line.
Click a variable in the Variables Names list and edit the Properties:
- Variable: If you have selected the append mode, select here the corresponding variable, otherwise this list is disabled.
- Name: Enter here the name of the variable, if you have selected on the second panel the option Use First Line as Variable Name, the name of the variable will automatically appear in the preview table.
-
Role:
- Borehole Name: this variable is mandatory.
- Coordinates: this is the X, Y or Z coordinate of the borehole tops. Each coordinate value must be defined. Otherwise an error message will occur.
- Depth From / Depth To: these two variables describe the minimum and maximum depths analyzed.
- Length: this variable is optional. It describes the borehole length. If it is not provided, the length is automatically calculated taking into account the samples definition.
- Numerical variable: numerical variables can be float or integer variables and are stored in 32 or 64 bits. Storage format for float variables is a question of variable precision. A 64 bits format guarantee a better precision but it will take more place on the machine. In Isatis.neo, coordinates are stored in 64 bits. For the integer variables, it depends on the variable values. An integer 32 bits allows the storage of values until 231, and until 263 with an integer 64 bits.
- Categorical variable: this kind of variable is made to deal with categories (with a maximum of 32767 categories). A category is associated to a specific string of characters (corresponding to an integer value) and to a dedicated color. The different categories of the variables are managed via a catalog. Categories are exclusive and they can not overlap themselves or a category can not contain two others for example.
- Text: text variables may be loaded in Isatis.neo. They are mainly used for selections and displays.
- Selection: a selection variable corresponds to a binary variable which can take the value 0 or 1 (equal 1 when the data point is inside the selection, 0 otherwise). A sample will be selected if the value of the selection variable is set to 1 and masked off if the value is 0. No undefined value is allowed in a selection variable. Many operators of Isatis.neo use a selection during input/read data table or output/write data table. In the input phase, this means that some samples will not be used during the calculation. In the output phase, this means that you do not want the operator to be applied to the masked samples.
- Unit Class: Enter here the unit class of the variable.
- Input File Unit: Select here the unit of the variable. If the Unit that you want to use is not proposed in the list, you can define your own unit by clicking on the More button.
- Tick the Use Default Display Unit option to define the Input File Unit as the unit used each time you will do something on this variable in Isatis.neo (display, statistics...). Otherwise the unit defined for the associated unit class in the Preferences will be used.
- Undefined: Usually undefined values are marked with a specific string in the file such as -99999, N/A or Undef. Enter here the correct undefined value.
- Detection Limit: Enter here a value that you want to consider as the detection limit. A DL is unique to each variable. All the values that are smaller than this detection limit will be replaced by the value of the detection limit.
An alternative to the global detection limit definition is to define directly in the input assay file values under the detection limit. Values that are below the detection limit need to be imported preceded by a ’<’symbol followed by the detection limit value (<2% with DL=2%).These values will be replaced by the value of the detection limit during the import.
In both case, a DL(VariableName) column is created in the preview table. If the DL value equals 0, it means that for the associated variable, the sample value is above the detection limit. If the DL value equals 1, it means that for the associated variable, the sample value is below the detection limit.
The Preview Using Display Unit Preferences area shows you the first lines of the file to help you choosing the properties of the variables. Click Unit Preferences to modify the Display Unit of the different variables.
The Preview zone shows you the first lines of the file to help you choosing the properties of the variables.
Summary
This last page sums up the variables definition.
Select the Display toggle to display the imported data in a defined scene at the end of the run.
Once you have defined all the parameter click Import to end the task.