
Neighborhood Definition
This step enables you to define a new moving neighborhood, to modify the parameters of an existing one and to check the performance of the current kriging.
Neighborhood Test
The test is achieved through a procedure which performs the kriging of one target point only at a time.
Let us recall that the kriging (of the target variable) is a linear combination of all the variables (secondary) defined at all the selected samples. In other words, each selected sample receives as many weights as there are defined variables. Therefore, for a given target variable (kriged variable), the weight attached to each sample may be displayed for each secondary variable involved in the estimation. The secondary variables may coincide with the target variable. That’s why, in multivariate mode, you can select a Test Variable and a Weights Variable.
Neighborhood test provides different types of results:
- Kriging: the result of the kriging interpolation,
- Std. Dev.: the standard deviation associated to the kriging (it corresponds to the uncertainty associated to the interpolation),
- Number of Neighbors: the number of samples used in the kriging,
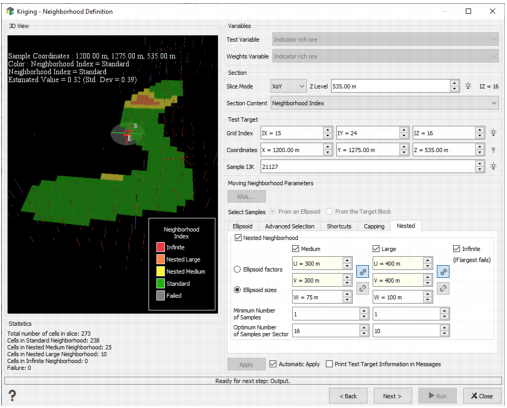
- Neighborhood Index: this result is computed when you apply a nested neighborhood (i.e. different neighborhoods of different scales, from the smaller to the larger one). To visualize which blocks belong to which neighborhood, select Neighborhood Index. By pressing Apply, the test window will display the map of the neighborhood indices.
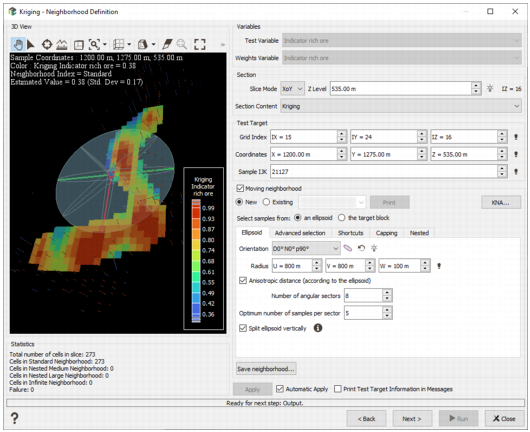
The test is performed on one target point which can be defined through its Grid Index (if the output file is a grid file), its Coordinates or its Sample Number. The target point can also be defined interactively by picking a point on the displayed map (by activating the Picking mode ![]() ).
).
Information about the target point (recall of the coordinates) and the associated results (asked color variable, estimated value and standard deviation) is displayed in the graphic.
Choose the Print Test Target Information in Messages option to display more information:
- the kriging weights: For each input variable V1, V2, etc., the list of its values at each sample location is recalled together with the corresponding kriging weights of the variable to be estimated.
- a recall of the variogram model and neighborhood parameters,
- advanced kriging results.
Moving Neighborhood Parameters
Click KNA to optimize the neighborhood parameters thanks to the Kriging Neighborhood Analysis window. If the selected output data table is a grid, KNA can be applied on a grid section (specified in the Section part of the interface) or on the whole file. If the output data table is not a grid, the KNA is calculated considering the whole file.
Then access to the Neighborhood Parameters Definition dialog area.
Click Save neighborhood to save your neighborhood parameters and use them in a second kriging or in Simulations.