
Merge categories
Objective
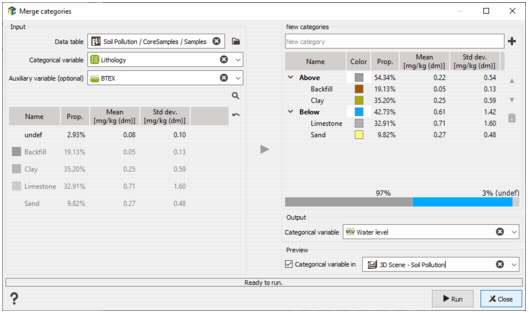
The Merge categories task allows you to easily create a new categorical variable (with a new catalog) from another one by selecting the input categories and grouping some of them into new categories. It is available either from the Data management / Create categories section of the ribbon, or directly doing a right-click on a categorical variable in the Data explorer.
Interface
Input
- Data table: Select the data table containing both the input categorical variable and the categorical variable to be created. Click the directory icon to open a Data Selector or directly drag and drop from the Data tree the data table you want to define as input.
- Categorical variable: Select the categorical variable to initialize the different categories you want to merge. It can be a simple categorical variable or a macro categorical variable. In the second case, the task can be applied on a specific index or on all the indices at once.
- Auxiliary variable (optional): A numerical variable can also be set to compute and display statistics (mean and standard deviation) of the variable for each category.
-
A filter can be used among the different input categories to easily find specific categories. Click on the magnify glass
 and enter a string of characters:
-
Activate the Case sensitivity
 option to treat as distinct uppercase and lowercase letters. By default they are equivalent.
-
Activate the Regular expression
 option to use regex for matching text.
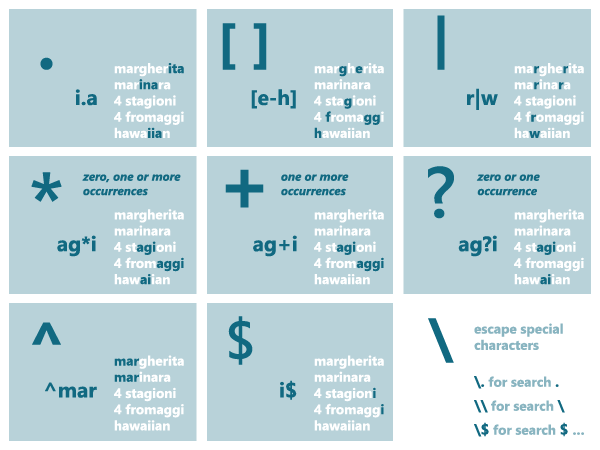
-
Activate the Case sensitivity
Pressing Enter, only the directories/variables corresponding to the search criterion will still appear in the Data tree.
When loading the input categorical variable, the different categories and associated colors are listed in a table just below. The proportion of each category is indicated in a dedicated column. By default, the different columns are sorted in the same order defined as in the catalog. But each column of the table is sortable by clicking on its header (by alphabetical order for the Name column or by ascending/descending order for the others). Click ![]() to retrieve the catalog order.
to retrieve the catalog order.
New categories
By default, the right part of the interface is empty. It shows a drop zone to invite you creating new categories. Two possibilities are available:
-
Enter the name of your new category in the New categories field and click
 to add the new category, or simply press ‘Enter’. Then, select, in the left table, the original categories you want to merge into the new category (which is highlighted) and press the arrow button
  . Categories can also be added to the new category by a simple drag-and-drop.
-
Instead of creating the new category using the empty field, you can directly select, in the left table, the categories you want to merge and click on the arrow button to send them at the right of the interface (or use a drag-and-drop). A new category, grouping the selected ones, will be automatically created. It will use the name and color of the first selected category by default but they are editable.
If you press the Ctrl key when dragging and dropping the selected categories from the left, you will create as many categories as selected ones.
Proportions and statistics (mean and standard deviation), if an input numerical variable has been provided, are computed and displayed for each new category.
When a category contained in the left table is used by the right table, it is greyed out and put at the bottom of the list.
The order of the new categories presented in the right table is important. It will use the same order for the catalog and it will also define the order of appearance for legend, color scale and statistics. You can play with the arrows ![]() /
/ ![]() to modify the order of the new output categories. You can use these same arrows to change to which new category an input category belongs to. A drag-and-drop can also be used to reorder the different categories.
to modify the order of the new output categories. You can use these same arrows to change to which new category an input category belongs to. A drag-and-drop can also be used to reorder the different categories.
Click ![]() to delete the selected categories. If the selected category is an existing category (from the input categorical variable), it will only remove it from the right table. If the selected category is a new category (from the output categorical variable), it will completely remove it from the right table and the category will not be created when running the task.
to delete the selected categories. If the selected category is an existing category (from the input categorical variable), it will only remove it from the right table. If the selected category is a new category (from the output categorical variable), it will completely remove it from the right table and the category will not be created when running the task.
Below the output categories table, a proportion bar displays the proportion of the current output categories. The total percentage of defined samples is displayed as well as the total percentage of undefined samples.
Output
A new Categorical variable (or macro categorical variable if the input is a macro) is created when running the task. If the variable already exists, a popup window will ask for an overwrite.
A check is also made on the catalog to verify if the name already exists and if it is associated with existing variable(s). In this case, another catalog with a unique name is created (catalog(1) for example). If the catalog is not used by any other variables, it is overwritten.
Preview
When creating the new categories, ticking this option allows you to visualize the final categorical variable in the Map or in the 3D Scene, depending on your choice. If the parameters (categories, colors, etc.) change, the preview will adapt on live.
In case of a selection of a macro categorical variable on input with all indices, the preview will be done using the first index.