
Licensing Activity Log
User logging is a tool that allows License Manager to track and record key events relating to licensing, including when a license is checked in, checked out, locked or unlocked.
This report also includes useful information about where each license was at any point time as both the source and destination of a license is recorded when an event occurs. A range of logging options, supported by both client- and server-side installations, generates an open-format comma-delimited-value (csv) file that can be used in a wide range of reporting packages in order to analyze license activity and usage over time.
The contents of this file are determined by settings on the Options screen.
License Services v5.00 and later versions will automatically install a useful example Excel® file that contains user logging data presented in a pivot table/chart format. Feel free to edit this file or the underlying macro (but make a copy first).
Note: to use this spreadsheet, Microsoft Office 2010 or later must be installed, and macros must be enabled.
This demonstration spreadsheet is called "Datamine_License_Logging_Demo_v1_1.xlsm" and can be found in your License Services installation folder, which is normally here, on a 64-bit operating system:
- C:\Program Files (x86)\Datamine\License Services
Log Files in Excel
As the output from the User Logging function is a comma-delimited-value file containing the attributes outlined in the previous section, you can process this data using a range of external reporting applications, such as the pivot charting facility in Excel, for example. Each Lock, Unlock, Check Out or Check In event is listed along with the time and date it occurred. For Unlock and Check In events, the duration of the preceding event is also recorded (in locked minutes for unlock events, in checked out days for check in events).
Consider a situation where 2 products; Studio OP and EPS InTouch are installed on the same machine and license logging is running locally, with both product licenses installed on the local machine. You launch Studio OP, which locks/secures the local base OP license, then closes it down after 6 minutes, which releases it. EPS InTouch is then launched for 2 minutes then closed. The expected logging output for this would be something like this:
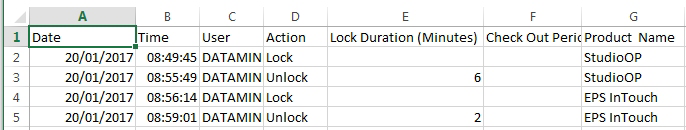
In this case, the events are linear, do not overlap and are in sequence. Note that the Lock Duration (Minutes) value will only appear for an unlock event - it is impossible to predict a duration of a lock when leasing a license. Similarly, the Check out event does not record a duration.
A Check In event registers the actual duration of the check out period. Replaying the above example, but instead of locking a license for each product, the user checks each out from a server for 10 days in advance, then checks them both in again after only 1 day, logging details similar to the following would appear:
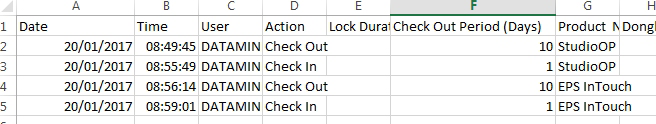
In this situation, the Lock Duration column is not used (as it is only relevant to license leasing/locking). Each log can contain any combination of events.
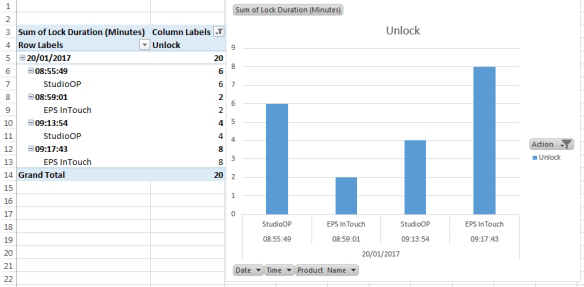
Using this raw data, you can use your reporting package's tools to display license activity information in a more digestible format; such as histogram to show the total hours used per license over a given period, the status of each license throughout a given day and so on. In the following example, a simple Excel pivot table and chart have been configured to show the duration of the recorded lock durations each time a license was unlocked and returned to local storage:
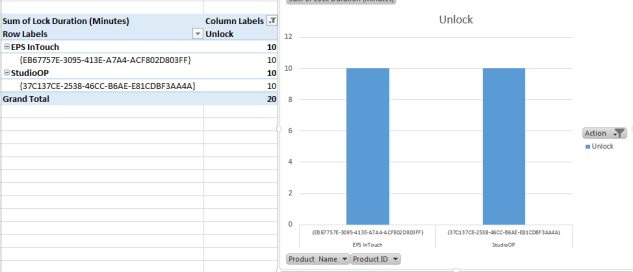
Alternatively, you could show the total lock duration of each license over the reporting period (e.g. a day):
Demonstration Data
The default chart shows results for the following:
- The duration (in minutes) for which a license was locked or leased by the local machine.
- The duration (in days) for which a license was checked out to the local machine.
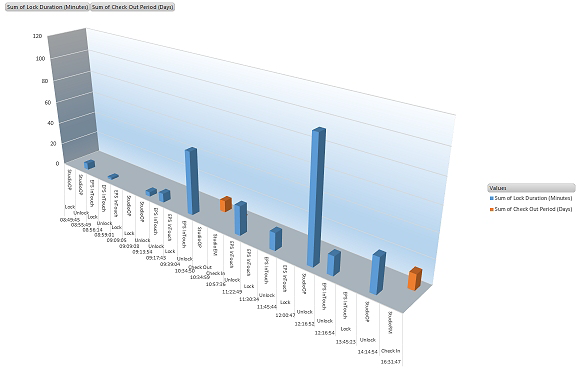
To view the demonstration licensing activity chart, open the demonstration Excel worksheet and cancel the Import dialog when it appears.
Then, select the Demonstration worksheet.
Data is presented in a 3D histogram spanning two distinct X axes (blue bars showing lock duration, orange bars showing check out duration). The same Y axis is shared for both data.
Each instance of a check in or unlock event is shown with its corresponding time - the example chart shows data for a log file that spans a single day:
The source data for this chart is contained in the Demo Data worksheet, which was created by importing a CSV daily log file exported from the User Logging tab in License Manager.
Using your Own Activity Log
Providing you have enabled macros in your Excel Trust Center, opening the demonstration worksheets shows the following prompt:
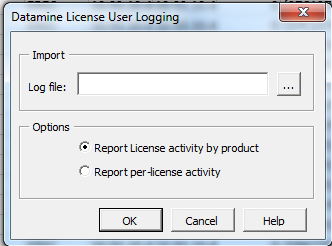
Select an existing .csv format log file on disk using the browse button.
Once a log file has been specified, the installed spreadsheet includes functionality to present this data using either of two preset formats:
- Report License activity by product (default): pivot charts showing a summary, per product, of license usage over the reporting period, shown as total minutes (unlock events) or days (check in events).
- Report per-license activity: pivot charts showing all licensing activity events (lock, unlock, check in, check out) for the time period covered by the selected log file. Unlock and Check In events also show the duration of the preceding activity.
In both of the above cases, a separate worksheet, chart and table are produced for lock/unlock and check in/check out data. Once selected and you click OK, pivot data will be generated automatically.
3 worksheets are added immediately after the "Demo Data" worksheet:
- A worksheet containing a tabular view of your log file data
- A worksheet containing a pivot table and chart displaying the duration of license locks, if any exist, either for every event (Report per-license activity) or as a summary over the reporting period for each distinct product (Report license activity by product), e.g.:
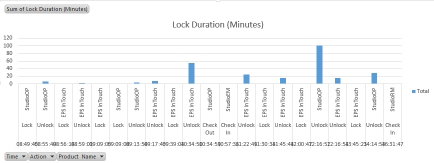
An example of a lock-duration graph showing all licensing events
For this selection, the Y-axis represents duration in minutes. - A worksheet containing a pivot table and chart displaying the duration of license checkouts, if any exist, either for every event (Report per-license activity) or as a summary over the reporting period for each distinct product (Report license activity by product), for example:
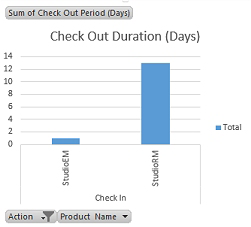
An example of a check-out-duration graph by product summary - For this selection, the Y-axis represents duration in days.
If the same log file is used, these sheets can be recreated/overwritten with successive uses of the Datamine License User Logging dialog.
License Solution Logs
Bound license solutions are an effective way of batching licenses/modules together. When a solution is accessed, and that event logged as part of the User Logging function, all licenses/modules within that solution are subject to the target event (lock, unlock, check in, check out) and a separate log file entry is recorded for each component of that solution.
As such, a log file tracking solution 'movement' can potentially contain a larger volume of log file records than one dealing with unbound, individual licenses.
As the log file contains the solution name reference (the final attribute in each row), the simplest way to deal with this is to pivot data based on a solution name instead of a product name.
Solution tracking example
For example, a log file captures an unlock event for a solution, which contains 40+ licenses. The log file will record 40 separate unlock events, one for each license and module contained within the solution. This is expected as each item within the solution is locked simultaneously. As such, if you create a pivot chart (as there is only one event, it won't matter if the data is pivoted on a product summary, or a licensing event) the result isn't that useful:
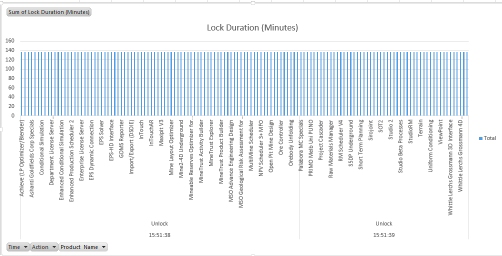
Pivoting the data on the solution name shows a cleaner result for this event:
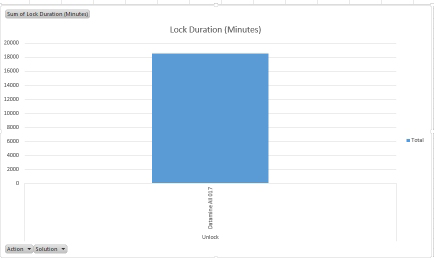
However, there is still an issue: the Y-axis shows the Sum of lock duration for all licenses (number of licenses within solution x duration). The easiest way to rectify this is to change the Field Value in the pivot table to show an average of all durations:
(Office 2013 version shown)
This adjusts the chart to show a more sensible duration value (Y-axis):
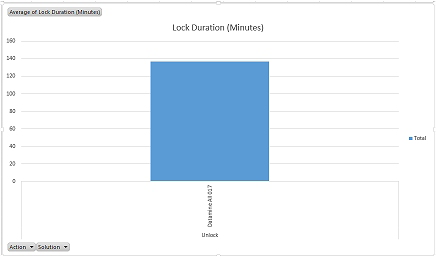
Chart and pivot tables are generated using a simple Visual Basic for Applications (VBA) macro that can be reviewed/edited as required (consult your Microsoft documentation for more information on access and editing VBA macros).If you intend to modify the demonstration license activity worksheet (source data, chart, pivot table or macro), you should save a copy first.
Warning: save a copy of the demo worksheet before modifying it.
Related topics and activities