
Map Sketches
Sketches are freeform map annotations, drawn in real-time with the mouse, stylus or finger.
Each sketch is listed in the Sketches table after drawing. This data is stored independently as sketch data for each map.
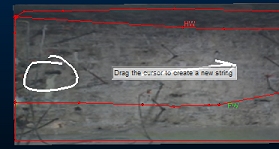
Specify the formatting for your sketch, then draw directly onto the active map face. This is ideal for highlighting areas of interest or to draw attention to a particular anomaly or structure that could be important in downstream analysis.
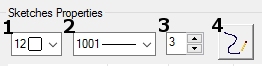
- Select sketch colour.
- Select line style
- Select line width
- Draw sketch
Each sketch can be associated with a comment, which can be added directly into the table below once a sketch has been drawn. You can also modify the formatting of previously-digitized sketches by adjusting the colour, line style or width for any table entry.
You can hide or show each sketch item using the visibility check box on the left of the table, and you can delete them (permanently) from the map using the X button in the table (on the far right of each table row).
Sketches are digitized either onto the current face map section, or if a level map is being created, onto either the reference section or the elevation profile of the imported survey data (meaning the sketch 'follows' the shape of the mapped backs in profile). Sketching onto a wireframe map automatically projects the sketched line onto the loaded surface.
Tip: Whilst sketching, you can complete the digitizing operation by double-clicking or double-tapping the final string vertex position. You can also complete the digitizing operation by closing the string.
Note: You can digitize face map data type using either the 3D map or butterfly map view. Butterfly maps are only available if your configuration permits it.
Related topics and activities