|
|
Project Data Bar How Studio NPVS organizes your scenario data |

The Project Data Bar
- The Project Data bar can be shown or hidden using the Home ribbon's Show | Project Data Bar option.
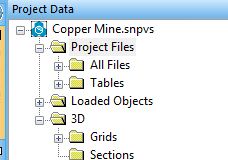
Your project contents can be managed using the Project Data control bar.
Presenting a summary of your project files (files associated with your project), loaded data objects and loaded 3D visual data, you can use the Project Data control bar to manage the contents of your project and the data you are working with.
|
|
Data that exists as a file on disk and has not yet been loaded into memory are referred to as "files". Once a file has been loaded, it becomes an "object". Some objects can be visualized, using one or more "overlays". Find out more about the View Hierarchy in Studio products... |
Context-sensitive menus give you object- and file-level control over your strategic planning data.
Your Project Data control bar is split into the following sections:
-
Project Files
Project files are files that are associated with your project. These files support your planning optimization scenarios. These file references can link to files anywhere accessible to your PC, such as standard legends, pit design data and so on.
More about the Project Files folder... -
Loaded Objects
All loaded data objects appear here, including visual (3D) and tabular data. Use this menu section to access object management tools and utilities.
More about the Loaded Objects folder... -
3D Folder(s)
You can display your 3D data in one or more 3D windows. Some planning tasks will automatically load visual data whereas others providing tools for you to "Load Data" associated with a particular task. For example, you can opt to load design data in advance of assigning manual attributes interactively.
Where multiple 3D windows are displayed, they can be 'independent', permitting unique/isolated formatting or linked to the primary 3D view.
Independent, embedded 3D windows are automatically created each time you view a new surface in a project session (say, pushback surfaces via the Visualize panel, for example).
Where new 3D windows are generated to display a project data file, the same file is added to whatever is currently shown in the primary 3D window. Each 3D window is displayed as a separate item in the Project Data control bar. Overlays for all displayed objects are listed within those folders and can be formatted and animated independently.
More about 3D window folders and object overlays...
More about independent and linked 3D windows...
-
Plots: Survey plots are listed in this part of the data bar. You can expand each item to reveal the data that comprises the plot. Selecting an item in this area will automatically display the Plots window.
More about plots...
") |
Related Topics |
|
|
Visualize Panel Project Data - ProjectFilesProject Data - Loaded ObjectsProject Data - 3D FoldersThe Planning WorkspaceTasks Pane OverviewUser Interface Overview |