
View Optimization Reports & Charts
Note: report contents are read-only. The title and sub-title are generated automatically based on reporting options.
Activity Steps
-
Create an Optimization Report or display an existing report.
-
To sort the report by a particular column:
-
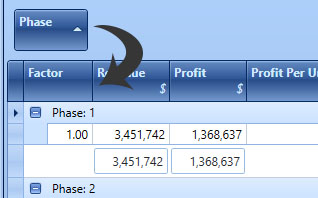
Right click a header cell by which you wish to sort report rows.
Note: right-clicking any other cell will display a menu to export tabular data.
-
Choose how to sort the selected column values:
-
Ascending - Sort numeric values by a natural numeric sort order (e.g., 1, 2, 11, 13 etc.)
-
Descending
-
Clear Sorting - If a column has been sorted previously, reinstate a default sort order, commonly ascending numerical order.
-
-
-
To group table rows by unique items in a particular column:
-
Right-click a column header.
-
Select Group by this Column.
The chart updates to show expandable / collapsible groups, grouped by the unique data values of the selected column.
-
To show or hide all table columns used for grouping:
-
Right-click any table column header cell.
-
Select Show Group Panel to toggle the display of the grouping panel.
Note: Drag column headers from the Group Panel onto the table's header row to remove grouping by that attribute, for example:
You can also specify grouping columns by dragging a header cell to the top left corner of the screen.
-
-
Select group items in the Group Panel to adjust an ascending / descending sort order.
-
-
To hide or show table columns:
-
Right-click any header cell and select Column Chooser.
The Column Chooser displays.
-
Select or deselect fields as required.
The report updates to show only selected fields.
-
Close the Column Chooser using the "X" icon.
-
-
To reorder the columns of a table, drag and drop a header cell to a new position.
-
To configure table column widths:
-
Resize individual table columns by dragging the vertical barrier between header cells.
Note: the cursor will change to a resize cursor when cell resizing is available.
-
Right-click a table column and select Best Fit to automatically resize a table column based on its current contents.
-
Right-click a table column and select Best Fit (all) to automatically resize all table columns based on their contents.
-
-
To filter the view of the report:
-
Right click any header cell and select Filter Editor.
The Filter Editor displays.
-
To add a new filter condition:
-
Expand the drop down menu at the top of the screen and select Add Condition.
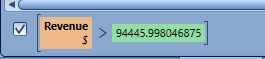
Field (orange) Operator (blue) and Value (green) fields appear.
-
Select the Field to compare with a value.
-
Select how to compare the field with a value using an Operator.
-
Select the Value. A drop down list displays all available values, or you can type your own.
-
If additional conditions are required for the filter, select And to display options for combining filters (And, Or, Not And, Not Or).
-
-
To remove a filter condition, select "X".
-
To create a group of filter conditions:
Note: Group filters to ensure multiple filters are subject to a particular condition. For example, you could filter results to show only revenues above $500,000 and phases 1-10 but only if profit is positive. In this case, profit is the grouping attribute whereas revenue and phase are conditions within that group.
Grouped filters are only applied if the group condition passes.-
Create the filters to be grouped.
-
Expand the drop down menu at the top of the screen and select Add Group.
Existing filters are grouped.
-
-
To create a custom condition:
-
Expand the drop down menu at the top of the screen and select Add Custom Expression.
An Enter an expression field displays.
-
Click within the Enter an expression field.
The Expression Editor displays.
-
To enter a logical expression manually, type into the field at the top of the screen. See Logical Expressions.
-
To construct a logical expression using menu options, pick Functions, Operators, Fields or Constants to display a list of available options and transfer an option to the expression field by double clicking.
Tips:
- Commonly used functions and operators are available on an icon strip below the expression field.
- A short description of each selected menu item will appear on the right.
- Cut and paste between the expression window and other text fields using standard keyboard controls (CTRL+C, CTRL+V).
-
-
Apply the filter expression (containing all conditions) to update the table, or dismiss the Filter Editor at the same time using OK.
The table is filtered and summary totals are updated. The filter will appear at the bottom of the table, for example:
-
-
To search within the current table:
-
If not already displayed, display the Search Panel by right-clicking any header cell and selecting Show Search Panel.
Tip: you can also display the search panel with

-
Enter any value into the search field.
All matching results are highlighted in the table as text is entered. Records with no matching values are automatically filtered.
-
-
To export data from the report to other systems:
-
Select the report value(s) to export.
Tip: to select the entire table, click the top left header cell.
-
Export data in a specific format:
-
To export data as a comma-delimited (.csv) file, right-click the table and select Export to CSV.
-
To export data in Excel format (.xlsx) file, right-click the table and select Export to XLSX.
-
-
-
To edit options used to generate the displayed report, and generate an updated report if required:
-
Right click a report anywhere outside of a table header cell.
-
Select Edit.
-
Use the Select fields to report screen to adjust reporting options.
-
If an updated report is required, click OK.
An updated report displays.
-
-
Save your project.
Related Topics and Activities