
Visualize Planning Surfaces
Once surface data has been generated for your project, say, by running the pushback generator, links become enabled on the Tasks Pane's Visualize tab.
This tab displays model and surface data links.
Clicking an active surface link automatically loads wireframe data
into the primary 3D view. If the data represents multiple operational
phases, for example, multiple pushbacks or scheduled mine periods, an Animation toolbar is presented
in the 3D view, docked to the bottom of the screen, for example: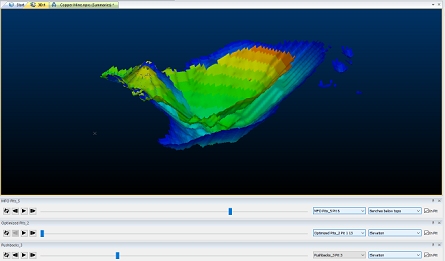
This toolbar is explained in more detail here. You use it to view a particular stage of operations, using the slider bar and other controls provided.
If multiple surface types are visualized, multiple Animation toolbars appear, allowing each loaded object overlay to be animated independently based on the appropriate animation attribute. For example, in the image below, both optimized pit shells and scheduler period pits have been selected on the Visualize panel. In the image below, secondary clipping is applied to reveal the cross section of both objects:
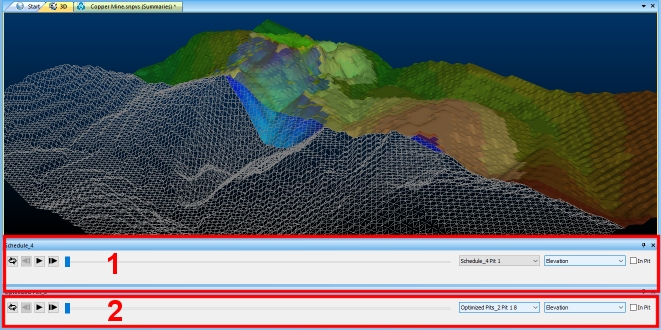
By formatting each object using the Wireframe Properties screen, adjusting display colours and transparency, you can show and animate multiple strategic planning wireframes independently.
You can, of course, unload surface data as any other 3D object, and you can also load in supporting reference data to enhance the scene (surface topography, contour strings and so on).
Related topics and activities: