
The Tasks Pane
To display this control bar:
-
Home ribbon >> Show >> Tasks Pane.
-
Home ribbon >> Optimization >> Tasks Pane.
Many of the commonly used tools you will use for strategic optimization projects and case studies can be found on the Tasks Pane.
This includes access points for all screens related to calculating the Optimal Extraction Sequence (OES). These controls are located on the Optimization panel. The top-bottom order of this panel reflects a typical progression of a long-term planning study.
Other panels exist for other tools relating to reporting, visualization and annotation.
Note: Many commands available in the Tasks Pane are also available via the ribbon system. Each help topic displays all possible access points at the top of the page.
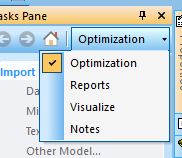
The Tasks Pane is a special type of control bar; it comprises multiple areas, accessible by a drop-down menu at the top of the bar:
-
The Optimization screen displays the list of commands in the top-bottom order you will normally follow to complete the project. Generally, tasks are only available if the expected inputs are also available (e.g. you cannot schedule pushbacks without an economic model).
See Optimization Tasks.
-
The Reports screen gives direct access to report making and to customization options.
See Tasks Pane - Reports.
-
The Visualize screen displays block models and surfaces at a click. You'll use it a lot to review the 3D outputs of the optimization workflow.
Each surface is shown in a dedicated window, allow multiple surfaces to be shown at the same time (e.g. imported slope regions, LG phases and pushbacks. All loaded surfaces (and any loaded models) are shown simultaneously in the primary 3D window.
-
The Export screen contains a list of exportable items.
See Tasks Pane - Export.
-
The Notes screen has a space where you can type your project notes.